Capital One 2014 Annual Report Download - page 66
Download and view the complete annual report
Please find page 66 of the 2014 Capital One annual report below. You can navigate through the pages in the report by either clicking on the pages listed below, or by using the keyword search tool below to find specific information within the annual report.-
 1
1 -
2
-
3
-
4
-
5
-
6
-
7
-
8
-
9
-
10
-
11
-
12
-
13
-
14
-
15
-
16
-
17
-
18
-
19
-
20
-
21
-
22
-
23
-
24
-
25
-
26
-
27
-
28
-
29
-
30
-
31
-
32
-
33
-
34
-
35
-
36
-
37
-
38
-
39
-
40
-
41
-
42
-
43
-
44
-
45
-
46
-
47
-
48
-
49
-
50
-
51
-
52
-
53
-
54
-
55
-
 56
56 -
 57
57 -
 58
58 -
 59
59 -
 60
60 -
 61
61 -
 62
62 -
 63
63 -
 64
64 -
 65
65 -
 66
66 -
 67
67 -
 68
68 -
 69
69 -
 70
70 -
 71
71 -
 72
72 -
 73
73 -
 74
74 -
 75
75 -
 76
76 -
77
-
78
-
79
-
80
-
81
-
82
-
83
-
84
-
85
-
86
-
87
-
88
-
89
-
90
-
91
-
92
-
93
-
94
-
95
-
96
-
97
-
98
-
99
-
100
-
101
-
102
-
103
-
104
-
105
-
106
-
107
-
108
-
109
-
110
-
111
-
112
-
113
-
114
-
115
-
116
-
117
-
118
-
119
-
120
-
121
-
122
-
123
-
124
-
125
-
126
-
127
-
128
-
129
-
130
-
131
-
132
-
133
-
134
-
135
-
136
-
137
-
138
-
139
-
140
-
141
-
142
-
143
-
144
-
145
-
146
-
147
-
148
-
149
-
150
-
151
-
152
-
153
-
154
-
155
-
156
-
157
-
158
-
159
-
160
-
161
-
162
-
163
-
164
-
165
-
166
-
167
-
168
-
169
-
170
-
171
-
172
-
173
-
174
-
175
-
176
-
177
-
178
-
179
-
180
-
181
-
182
-
183
-
184
-
185
-
186
-
187
-
188
-
189
-
190
-
191
-
192
-
193
-
194
-
195
-
196
-
197
-
198
-
199
-
200
-
201
-
202
-
203
-
204
-
205
-
206
-
207
-
208
-
209
-
210
-
211
-
212
-
213
-
214
-
215
-
216
-
217
-
218
-
219
-
220
-
221
-
222
-
223
-
224
-
225
-
226
-
227
-
228
-
229
-
230
-
231
-
232
-
233
-
234
-
235
-
236
-
237
-
238
-
239
-
240
-
241
-
242
-
243
-
244
-
245
-
246
-
247
-
248
-
249
-
250
-
251
-
252
-
253
-
254
-
255
-
256
-
257
-
258
-
259
-
260
-
261
-
262
-
263
-
264
-
265
-
266
-
267
-
268
-
269
-
270
-
271
-
272
-
273
-
274
-
275
-
276
-
277
-
278
-
279
-
280
-
281
-
282
-
283
-
284
-
285
-
286
-
287
-
288
-
289
-
290
-
291
-
292
-
293
-
294
-
295
-
296
-
297
-
298
-
299
-
300
 |
 |
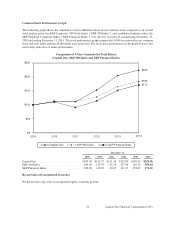
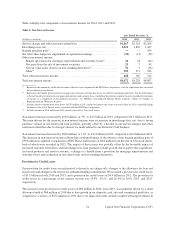
We build our allowance for loan and lease losses and reserve for unfunded lending commitments through the
provision for credit losses. Our provision for credit losses in each period is driven by charge-offs, changes to
allowance for loan and lease losses, and changes to unfunded lending commitments. We recorded a provision for
credit losses of $3.5 billion in both 2014 and 2013, and $4.4 billion in 2012.
We have an established process, using analytical tools and management judgment, to determine our allowance for
loan and lease losses. Losses are inherent in our loan portfolio and we calculate the allowance for loan and lease
losses by estimating incurred losses for segments of our loan portfolio with similar risk characteristics and record a
provision for credit losses. The allowance totaled $4.4 billion as of December 31, 2014, compared to $4.3 billion as
of December 31, 2013.
We review and assess our allowance methodologies and adequacy of the allowance for loan and lease losses on a
quarterly basis. Our assessment involves evaluating many factors including, but not limited to, historical loss and
recovery experience, recent trends in delinquencies and charge-offs, risk ratings, the impact of bankruptcy filings,
the value of collateral underlying secured loans, account seasoning, changes in our credit evaluation, underwriting
and collection management policies, seasonality, general economic conditions, changes in the legal and regulatory
environment and uncertainties in forecasting and modeling techniques used in estimating our allowance for loan
and lease losses. Key factors that have a significant impact on our allowance for loan and lease losses include
assumptions about unemployment rates, home prices, and the valuation of commercial properties and other
collateral, consumer real estate, and automobiles.
In addition to the allowance for loan and lease losses, we review and assess our estimate of probable losses related to
unfunded lending commitments, such as letters of credit and financial guarantees, and unfunded loan commitments on
a quarterly basis. The factors impacting our assessment generally align with those considered in our evaluation of the
allowance for loan and lease losses for the Commercial Banking business. Changes to the reserve for losses on unfunded
lending commitments are recorded through the provision for credit losses in the consolidated statements of income
and to other liabilities on the consolidated balance sheets.
Although we examine a variety of externally available data, as well as our internal loan performance data, to
determine our allowance for loan and lease losses and reserve for unfunded lending commitments, our estimation
process is subject to risks and uncertainties, including a reliance on historical loss and trend information that may not
be representative of current conditions and indicative of future performance. Accordingly, our actual credit loss
experience may not be in line with our expectations. We provide additional information on the methodologies and key
assumptions used in determining our allowance for loan and lease losses for each of our loan portfolio segments in
“Note 1—Summary of Significant Accounting Policies.” We provide information on the components of our allowance,
disaggregated by impairment methodology, and changes in our allowance in “Note 5—Allowance for Loan and Lease
Losses.”
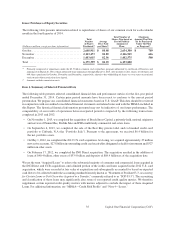
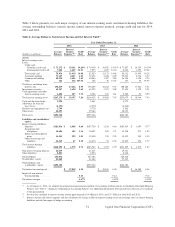
Finance Charge and Fee Reserves
Finance charges and fees on credit card loans, net of amounts that we consider uncollectible, are included in loan
receivables and revenue when the finance charges and fees are earned. We continue to accrue finance charges and fees
on credit card loans until the account is charged-off; however, when we do not expect full payment of billed finance
charges and fees, we reduce the balance of our credit card loan receivables by the amount of finance charges and fees
billed but not expected to be collected and exclude this amount from revenue. Total net revenue was reduced by
$645 million, $796 million and $937 million in 2014, 2013 and 2012, respectively, for the estimated uncollectible
amount of billed finance charges and fees. The finance charge and fee reserve totaled $216 million as of December 31,
2014, compared to $190 million as of December 31, 2013.
We review and assess the adequacy of the uncollectible finance charge and fee reserve on a quarterly basis. Our
methodology for estimating the uncollectible portion of billed finance charges and fees is consistent with the methodology
we use to estimate the allowance for incurred losses on the principal portion of our credit card loan receivables.
44 Capital One Financial Corporation (COF)