Capital One 2014 Annual Report Download - page 190
Download and view the complete annual report
Please find page 190 of the 2014 Capital One annual report below. You can navigate through the pages in the report by either clicking on the pages listed below, or by using the keyword search tool below to find specific information within the annual report.-
 1
1 -
2
-
3
-
4
-
5
-
6
-
7
-
8
-
9
-
10
-
11
-
12
-
13
-
14
-
15
-
16
-
17
-
18
-
19
-
20
-
21
-
22
-
23
-
24
-
25
-
26
-
27
-
28
-
29
-
30
-
31
-
32
-
33
-
34
-
35
-
36
-
37
-
38
-
39
-
40
-
41
-
42
-
43
-
44
-
45
-
46
-
47
-
48
-
49
-
50
-
51
-
52
-
53
-
54
-
55
-
56
-
57
-
58
-
59
-
60
-
61
-
62
-
63
-
64
-
65
-
66
-
67
-
68
-
69
-
70
-
71
-
72
-
73
-
74
-
75
-
76
-
77
-
78
-
79
-
80
-
81
-
82
-
83
-
84
-
85
-
86
-
87
-
88
-
89
-
90
-
91
-
92
-
93
-
94
-
95
-
96
-
97
-
98
-
99
-
100
-
101
-
102
-
103
-
104
-
105
-
106
-
107
-
108
-
109
-
110
-
111
-
112
-
113
-
114
-
115
-
116
-
117
-
118
-
119
-
120
-
121
-
122
-
123
-
124
-
125
-
126
-
127
-
128
-
129
-
130
-
131
-
132
-
133
-
134
-
135
-
136
-
137
-
138
-
139
-
140
-
141
-
142
-
143
-
144
-
145
-
146
-
147
-
148
-
149
-
150
-
151
-
152
-
153
-
154
-
155
-
156
-
157
-
158
-
159
-
160
-
161
-
162
-
163
-
164
-
165
-
166
-
167
-
168
-
169
-
170
-
171
-
172
-
173
-
174
-
175
-
176
-
177
-
178
-
179
-
 180
180 -
 181
181 -
 182
182 -
 183
183 -
 184
184 -
 185
185 -
 186
186 -
 187
187 -
 188
188 -
 189
189 -
 190
190 -
 191
191 -
 192
192 -
 193
193 -
 194
194 -
 195
195 -
 196
196 -
 197
197 -
 198
198 -
 199
199 -
 200
200 -
201
-
202
-
203
-
204
-
205
-
206
-
207
-
208
-
209
-
210
-
211
-
212
-
213
-
214
-
215
-
216
-
217
-
218
-
219
-
220
-
221
-
222
-
223
-
224
-
225
-
226
-
227
-
228
-
229
-
230
-
231
-
232
-
233
-
234
-
235
-
236
-
237
-
238
-
239
-
240
-
241
-
242
-
243
-
244
-
245
-
246
-
247
-
248
-
249
-
250
-
251
-
252
-
253
-
254
-
255
-
256
-
257
-
258
-
259
-
260
-
261
-
262
-
263
-
264
-
265
-
266
-
267
-
268
-
269
-
270
-
271
-
272
-
273
-
274
-
275
-
276
-
277
-
278
-
279
-
280
-
281
-
282
-
283
-
284
-
285
-
286
-
287
-
288
-
289
-
290
-
291
-
292
-
293
-
294
-
295
-
296
-
297
-
298
-
299
-
300
 |
 |

168
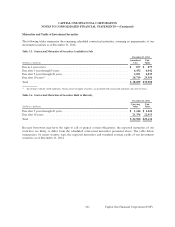
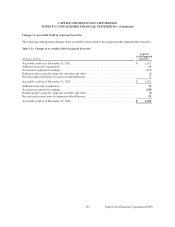
On February 19, 2013, we announced the Portfolio Sale of loans that we acquired in the 2012 U.S. card acquisition.
We reclassified the assets subject to the sale agreement, which included loans of approximately $7 billion as of the
date of the transfer, to the held for sale category from the held for investment category in the first quarter of 2013.
We transferred the net assets subject to the sale agreement to the held for sale category upon meeting the pertinent
criteria for this classification during the first quarter of 2013. The loan portfolio was transferred to held for sale
based upon the carrying value of the loans, including the transfer of the allowance for loan losses. All other net
assets subject to the sale agreement were transferred to held for sale at fair value less costs to sell. During the held
for sale period, we continued to recognize interest and fee income on the transferred loans, and did not recognize
any impacts from charge-offs and recoveries unless these net charge-offs exceeded the associated transferred
allowance for loan losses. The amortization and accretion on the related intangibles ceased upon the transfer to
the held for sale category. The Portfolio Sale was completed on September 6, 2013. We recognized $26 million of
lower of cost or fair value adjustments related to the portfolio assets.
We had total loans held for sale of $626 million and $218 million as of December 31, 2014 and 2013, respectively.
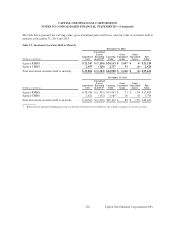
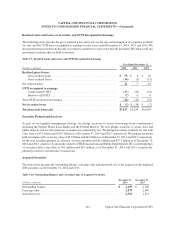
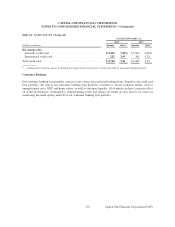
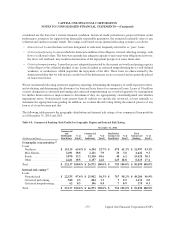
Table 4.2 presents loans 90 days or more past due that continue to accrue interest and loans classified as
nonperforming as of December 31, 2014 and 2013.
Table 4.2: 90+ Day Delinquent Loans Accruing Interest and Nonperforming Loans(1)
December 31, 2014 December 31, 2013
≥90 Days ≥90 Days
and Nonperforming and Nonperforming
(Dollars in millions) Accruing Loans Accruing Loans
Credit Card:
Domestic credit card . . . . . . . . . . . . . . . . . . . . . . . . . . . . . . . $1,181 $ 0 $ 1,187 $ 0
International credit card . . . . . . . . . . . . . . . . . . . . . . . . . . . . 73 70 96 88
Total credit card . . . . . . . . . . . . . . . . . . . . . . . . . . . . . . . . . . . . 1,254 70 1,283 88
Consumer Banking:
Auto . . . . . . . . . . . . . . . . . . . . . . . . . . . . . . . . . . . . . . . . . . . 0 197 0 194
Home loan . . . . . . . . . . . . . . . . . . . . . . . . . . . . . . . . . . . . . . . 0 330 0 376
Retail banking . . . . . . . . . . . . . . . . . . . . . . . . . . . . . . . . . . . . 1 22 2 41
Total consumer banking . . . . . . . . . . . . . . . . . . . . . . . . . . . . . . 1 549 2 611
Commercial Banking:
Commercial and multifamily real estate . . . . . . . . . . . . . . . . 7 62 2 52
Commercial and industrial . . . . . . . . . . . . . . . . . . . . . . . . . . 1 106 4 93
Total commercial lending . . . . . . . . . . . . . . . . . . . . . . . . . 8 168 6 145
Small-ticket commercial real estate . . . . . . . . . . . . . . . . . . . 0704
Total commercial banking . . . . . . . . . . . . . . . . . . . . . . . . . . 8 175 6 149
Other:
Other loans . . . . . . . . . . . . . . . . . . . . . . . . . . . . . . . . . . . . . . 0 15 0 19
Total . . . . . . . . . . . . . . . . . . . . . . . . . . . . . . . . . . . . . . . . . . . . . $1,263 $ 809 $ 1,291 $ 867
% of Total loans . . . . . . . . . . . . . . . . . . . . . . . . . . . . . . . . . . . . 0.61% 0.39% 0.65% 0.44%
(1) Nonperforming loans generally include loans that have been placed on nonaccrual status. Acquired Loans are excluded from loans reported
as 90 days and accruing interest as well as nonperforming loans.
CAPITAL ONE FINANCIAL CORPORATION
NOTES TO CONSOLIDATED FINANCIAL STATEMENTS—(Continued)
Capital One Financial Corporation (COF)