Capital One 2014 Annual Report Download - page 140
Download and view the complete annual report
Please find page 140 of the 2014 Capital One annual report below. You can navigate through the pages in the report by either clicking on the pages listed below, or by using the keyword search tool below to find specific information within the annual report.-
 1
1 -
2
-
3
-
4
-
5
-
6
-
7
-
8
-
9
-
10
-
11
-
12
-
13
-
14
-
15
-
16
-
17
-
18
-
19
-
20
-
21
-
22
-
23
-
24
-
25
-
26
-
27
-
28
-
29
-
30
-
31
-
32
-
33
-
34
-
35
-
36
-
37
-
38
-
39
-
40
-
41
-
42
-
43
-
44
-
45
-
46
-
47
-
48
-
49
-
50
-
51
-
52
-
53
-
54
-
55
-
56
-
57
-
58
-
59
-
60
-
61
-
62
-
63
-
64
-
65
-
66
-
67
-
68
-
69
-
70
-
71
-
72
-
73
-
74
-
75
-
76
-
77
-
78
-
79
-
80
-
81
-
82
-
83
-
84
-
85
-
86
-
87
-
88
-
89
-
90
-
91
-
92
-
93
-
94
-
95
-
96
-
97
-
98
-
99
-
100
-
101
-
102
-
103
-
104
-
105
-
106
-
107
-
108
-
109
-
110
-
111
-
112
-
113
-
114
-
115
-
116
-
117
-
118
-
119
-
120
-
121
-
122
-
123
-
124
-
125
-
126
-
127
-
128
-
129
-
 130
130 -
 131
131 -
 132
132 -
 133
133 -
 134
134 -
 135
135 -
 136
136 -
 137
137 -
 138
138 -
 139
139 -
 140
140 -
 141
141 -
 142
142 -
 143
143 -
 144
144 -
 145
145 -
 146
146 -
 147
147 -
 148
148 -
 149
149 -
 150
150 -
151
-
152
-
153
-
154
-
155
-
156
-
157
-
158
-
159
-
160
-
161
-
162
-
163
-
164
-
165
-
166
-
167
-
168
-
169
-
170
-
171
-
172
-
173
-
174
-
175
-
176
-
177
-
178
-
179
-
180
-
181
-
182
-
183
-
184
-
185
-
186
-
187
-
188
-
189
-
190
-
191
-
192
-
193
-
194
-
195
-
196
-
197
-
198
-
199
-
200
-
201
-
202
-
203
-
204
-
205
-
206
-
207
-
208
-
209
-
210
-
211
-
212
-
213
-
214
-
215
-
216
-
217
-
218
-
219
-
220
-
221
-
222
-
223
-
224
-
225
-
226
-
227
-
228
-
229
-
230
-
231
-
232
-
233
-
234
-
235
-
236
-
237
-
238
-
239
-
240
-
241
-
242
-
243
-
244
-
245
-
246
-
247
-
248
-
249
-
250
-
251
-
252
-
253
-
254
-
255
-
256
-
257
-
258
-
259
-
260
-
261
-
262
-
263
-
264
-
265
-
266
-
267
-
268
-
269
-
270
-
271
-
272
-
273
-
274
-
275
-
276
-
277
-
278
-
279
-
280
-
281
-
282
-
283
-
284
-
285
-
286
-
287
-
288
-
289
-
290
-
291
-
292
-
293
-
294
-
295
-
296
-
297
-
298
-
299
-
300
 |
 |

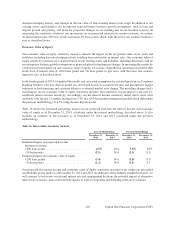
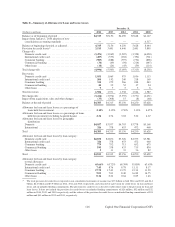
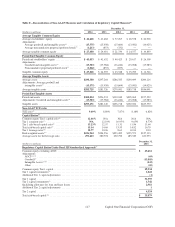
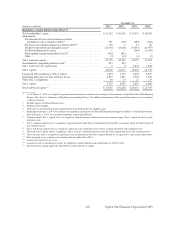
December 31,
(Dollars in millions) 2013 2012 2011 2010
Regulatory Capital Ratios Under Basel I(5)
Total stockholders’ equity . . . . . . . . . . . . . . . . . . . . . . . . . . . . . . . . . . . . . . . . $ 41,632 $ 40,425 $ 29,617 $ 26,509
Adjustments:
Net unrealized losses on investment securities
available for sale recorded in AOCI(12) . . . . . . . . . . . . . . . . . . . . . . . . . . . 791 (712) (289) (368)
Net losses on cash flow hedges recorded in AOCI(12) . . . . . . . . . . . . . . . . . 136 2 71 86
Disallowed goodwill and intangible assets(2) . . . . . . . . . . . . . . . . . . . . . . . . (14,326) (14,428) (13,855) (13,953)
Disallowed deferred tax assets . . . . . . . . . . . . . . . . . . . . . . . . . . . . . . . . . . — — (563) (1,169)
Noncumulative perpetual preferred stock(3) . . . . . . . . . . . . . . . . . . . . . . . . . (853) (853) — —
Other . . . . . . . . . . . . . . . . . . . . . . . . . . . . . . . . . . . . . . . . . . . . . . . . . . . . . . (5) (12) (2) (2)
Tier 1 common capital . . . . . . . . . . . . . . . . . . . . . . . . . . . . . . . . . . . . . . . . . . . 27,375 24,422 14,979 11,103
Noncumulative perpetual preferred stock(3) . . . . . . . . . . . . . . . . . . . . . . . . . . . 853 853 — —
Tier 1 restricted core capital items . . . . . . . . . . . . . . . . . . . . . . . . . . . . . . . . . 2 2 3,635 3,636
Tier 1 capital . . . . . . . . . . . . . . . . . . . . . . . . . . . . . . . . . . . . . . . . . . . . . . . . . . 28,230 25,277 18,614 14,739
Long-term debt qualifying as Tier 2 capital . . . . . . . . . . . . . . . . . . . . . . . . . . 1,914 2,119 2,438 2,827
Qualifying allowance for loan and lease losses . . . . . . . . . . . . . . . . . . . . . . . . 2,833 2,831 1,978 3,750
Other Tier 2 components . . . . . . . . . . . . . . . . . . . . . . . . . . . . . . . . . . . . . . . . . 10 13 23 29
Tier 2 capital . . . . . . . . . . . . . . . . . . . . . . . . . . . . . . . . . . . . . . . . . . . . . . . . . . 4,757 4,963 4,439 6,606
Total risk-based capital(14) . . . . . . . . . . . . . . . . . . . . . . . . . . . . . . . . . . . . . . . . $ 32,987 $ 30,240 $ 23,053 $ 21,345
(1) As of January 1, 2014, we adopted the proportional amortization method of accounting for Investments in Qualified Affordable Housing
Projects. See “Note 1—Summary of Significant Accounting Policies” for additional information. Prior periods have been recast to conform
to this presentation.
(2) Includes impact of related deferred taxes.
(3) Includes related surplus.
(4) TCE ratio is a non-GAAP measure calculated based on TCE divided by tangible assets.
(5) Beginning on January 1, 2014, we calculate our regulatory capital under the Basel III Standardized Approach subject to transition provisions.
Prior to January 1, 2014, we calculated regulatory capital under Basel I.
(6) Common equity Tier 1 capital ratio is a regulatory capital measure calculated based on common equity Tier 1 capital divided by risk-
weighted assets.
(7) Tier 1 common capital ratio is a regulatory capital measure under Basel I calculated based on Tier 1 common capital divided by Basel I
risk-weighted assets.
(8) Tier 1 risk-based capital ratio is a regulatory capital measure calculated based on Tier 1 capital divided by risk-weighted assets.
(9) Total risk-based capital ratio is a regulatory capital measure calculated based on total risk-based capital divided by risk-weighted assets.
(10) Tier 1 leverage ratio is a regulatory capital measure calculated based on Tier 1 capital divided by average assets, after certain adjustments.
(11) Risk-weighted assets continue to be calculated based on Basel I in 2014.
(12) Amounts presented are net of tax.
(13) Amounts based on transition provisions for regulatory capital deductions and adjustments of 20% for 2014.
(14) Total risk-based capital equals the sum of Tier 1 capital and Tier 2 capital.
118 Capital One Financial Corporation (COF)