Capital One 2014 Annual Report Download - page 229
Download and view the complete annual report
Please find page 229 of the 2014 Capital One annual report below. You can navigate through the pages in the report by either clicking on the pages listed below, or by using the keyword search tool below to find specific information within the annual report.-
 1
1 -
2
-
3
-
4
-
5
-
6
-
7
-
8
-
9
-
10
-
11
-
12
-
13
-
14
-
15
-
16
-
17
-
18
-
19
-
20
-
21
-
22
-
23
-
24
-
25
-
26
-
27
-
28
-
29
-
30
-
31
-
32
-
33
-
34
-
35
-
36
-
37
-
38
-
39
-
40
-
41
-
42
-
43
-
44
-
45
-
46
-
47
-
48
-
49
-
50
-
51
-
52
-
53
-
54
-
55
-
56
-
57
-
58
-
59
-
60
-
61
-
62
-
63
-
64
-
65
-
66
-
67
-
68
-
69
-
70
-
71
-
72
-
73
-
74
-
75
-
76
-
77
-
78
-
79
-
80
-
81
-
82
-
83
-
84
-
85
-
86
-
87
-
88
-
89
-
90
-
91
-
92
-
93
-
94
-
95
-
96
-
97
-
98
-
99
-
100
-
101
-
102
-
103
-
104
-
105
-
106
-
107
-
108
-
109
-
110
-
111
-
112
-
113
-
114
-
115
-
116
-
117
-
118
-
119
-
120
-
121
-
122
-
123
-
124
-
125
-
126
-
127
-
128
-
129
-
130
-
131
-
132
-
133
-
134
-
135
-
136
-
137
-
138
-
139
-
140
-
141
-
142
-
143
-
144
-
145
-
146
-
147
-
148
-
149
-
150
-
151
-
152
-
153
-
154
-
155
-
156
-
157
-
158
-
159
-
160
-
161
-
162
-
163
-
164
-
165
-
166
-
167
-
168
-
169
-
170
-
171
-
172
-
173
-
174
-
175
-
176
-
177
-
178
-
179
-
180
-
181
-
182
-
183
-
184
-
185
-
186
-
187
-
188
-
189
-
190
-
191
-
192
-
193
-
194
-
195
-
196
-
197
-
198
-
199
-
200
-
201
-
202
-
203
-
204
-
205
-
206
-
207
-
208
-
209
-
210
-
211
-
212
-
213
-
214
-
215
-
216
-
217
-
218
-
 219
219 -
 220
220 -
 221
221 -
 222
222 -
 223
223 -
 224
224 -
 225
225 -
 226
226 -
 227
227 -
 228
228 -
 229
229 -
 230
230 -
 231
231 -
 232
232 -
 233
233 -
 234
234 -
 235
235 -
 236
236 -
 237
237 -
 238
238 -
 239
239 -
240
-
241
-
242
-
243
-
244
-
245
-
246
-
247
-
248
-
249
-
250
-
251
-
252
-
253
-
254
-
255
-
256
-
257
-
258
-
259
-
260
-
261
-
262
-
263
-
264
-
265
-
266
-
267
-
268
-
269
-
270
-
271
-
272
-
273
-
274
-
275
-
276
-
277
-
278
-
279
-
280
-
281
-
282
-
283
-
284
-
285
-
286
-
287
-
288
-
289
-
290
-
291
-
292
-
293
-
294
-
295
-
296
-
297
-
298
-
299
-
300
 |
 |

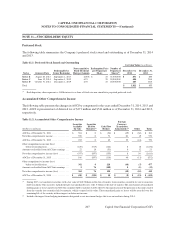
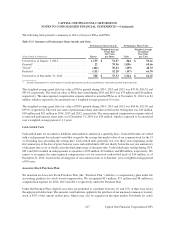
NOTE 11—STOCKHOLDERS’ EQUITY
Preferred Stock
The following table summarizes the Company’s preferred stock issued and outstanding as of December 31, 2014
and 2013.
Table 11.1: Preferred Stock Issued and Outstanding
Carrying Value (in millions)
Non-cumulative Redemption Price Number of
Redeemable by Fixed Dividend per Depositary Depositary December 31, December 31,
Series Issuance Date Issuer Beginning Rate per Annum Share Shares(1) 2014 2013
Series B August 20, 2012 September 1, 2017 6.00% $ 25 35,000,000 $ 853 $ 853
Series C June 12, 2014 September 1, 2019 6.25 25 20,000,000 484 N/A
Series D October 31, 2014 December 1, 2019 6.70 25 20,000,000 485 N/A
Total $ 1,822 $ 853
(1) Each depositary share represents a 1/40th interest in a share of fixed-rate non-cumulative perpetual preferred stock.
Accumulated Other Comprehensive Income
The following table presents the changes in AOCI by component for the years ended December 31, 2014, 2013 and
2012. AOCI is presented net of deferred tax of $171 million and $544 million as of December 31, 2014 and 2013,
respectively.
Table 11.2: Accumulated Other Comprehensive Income
Foreign
Securities Securities Currency
Available Held to Cash Flow Translation
(Dollars in millions) for Sale Maturity(1) Hedges Adjustments(2) Other Total
AOCI as of December 31, 2011 . . . . . . . . . . . . . . . $ 304 $ 0 $ (26) $ (49) $ (60) $ 169
Net other comprehensive income . . . . . . . . . . . . . . 399 0 71 81 19 570
AOCI as of December 31, 2012 . . . . . . . . . . . . . . . 703 0 45 32 (41) 739
Other comprehensive income (loss)
before reclassifications . . . . . . . . . . . . . . . . . . . (619) (915) (124) 8 18 (1,632)
Amounts reclassified from AOCI into earnings . . . 22 18 (31) 0 12 21
Net other comprehensive income (loss) . . . . . . . . . (597) (897) (155) 8 30 (1,611)
AOCI as of December 31, 2013 . . . . . . . . . . . . . . . 106 (897) (110) 40 (11) (872)
Other comprehensive income (loss)
before reclassifications . . . . . . . . . . . . . . . . . . . 302 0 228 (48) (5) 477
Amounts reclassified from AOCI into earnings . . . 2 76 (108) 0 (5) (35)
Net other comprehensive income (loss) . . . . . . . . . 304 76 120 (48) (10) 442
AOCI as of December 31, 2014 . . . . . . . . . . . . . . . $ 410 $ (821) $ 10 $ (8) $ (21) $ (430)
(1) During 2013, we transferred securities with a fair value of $18.3 billion on the date of transfer, from securities available for sale to securities
held to maturity. The securities included net pre-tax unrealized losses of $1.5 billion at the date of transfer. The amortization of unrealized
holding gains or losses reported in AOCI for securities held to maturity will be offset by the amortization of the premium or discount created
from the transfer into securities held to maturity, which occurred at fair value. These unrealized gains or losses will be recorded over the
remaining life of the security with no impact on future net income.
(2) Includes the impact from hedging instruments designated as net investment hedges that were entered into during 2014.
207
CAPITAL ONE FINANCIAL CORPORATION
NOTES TO CONSOLIDATED FINANCIAL STATEMENTS—(Continued)
Capital One Financial Corporation (COF)