Capital One 2014 Annual Report Download - page 274
Download and view the complete annual report
Please find page 274 of the 2014 Capital One annual report below. You can navigate through the pages in the report by either clicking on the pages listed below, or by using the keyword search tool below to find specific information within the annual report.-
 1
1 -
2
-
3
-
4
-
5
-
6
-
7
-
8
-
9
-
10
-
11
-
12
-
13
-
14
-
15
-
16
-
17
-
18
-
19
-
20
-
21
-
22
-
23
-
24
-
25
-
26
-
27
-
28
-
29
-
30
-
31
-
32
-
33
-
34
-
35
-
36
-
37
-
38
-
39
-
40
-
41
-
42
-
43
-
44
-
45
-
46
-
47
-
48
-
49
-
50
-
51
-
52
-
53
-
54
-
55
-
56
-
57
-
58
-
59
-
60
-
61
-
62
-
63
-
64
-
65
-
66
-
67
-
68
-
69
-
70
-
71
-
72
-
73
-
74
-
75
-
76
-
77
-
78
-
79
-
80
-
81
-
82
-
83
-
84
-
85
-
86
-
87
-
88
-
89
-
90
-
91
-
92
-
93
-
94
-
95
-
96
-
97
-
98
-
99
-
100
-
101
-
102
-
103
-
104
-
105
-
106
-
107
-
108
-
109
-
110
-
111
-
112
-
113
-
114
-
115
-
116
-
117
-
118
-
119
-
120
-
121
-
122
-
123
-
124
-
125
-
126
-
127
-
128
-
129
-
130
-
131
-
132
-
133
-
134
-
135
-
136
-
137
-
138
-
139
-
140
-
141
-
142
-
143
-
144
-
145
-
146
-
147
-
148
-
149
-
150
-
151
-
152
-
153
-
154
-
155
-
156
-
157
-
158
-
159
-
160
-
161
-
162
-
163
-
164
-
165
-
166
-
167
-
168
-
169
-
170
-
171
-
172
-
173
-
174
-
175
-
176
-
177
-
178
-
179
-
180
-
181
-
182
-
183
-
184
-
185
-
186
-
187
-
188
-
189
-
190
-
191
-
192
-
193
-
194
-
195
-
196
-
197
-
198
-
199
-
200
-
201
-
202
-
203
-
204
-
205
-
206
-
207
-
208
-
209
-
210
-
211
-
212
-
213
-
214
-
215
-
216
-
217
-
218
-
219
-
220
-
221
-
222
-
223
-
224
-
225
-
226
-
227
-
228
-
229
-
230
-
231
-
232
-
233
-
234
-
235
-
236
-
237
-
238
-
239
-
240
-
241
-
242
-
243
-
244
-
245
-
246
-
247
-
248
-
249
-
250
-
251
-
252
-
253
-
254
-
255
-
256
-
257
-
258
-
259
-
260
-
261
-
262
-
263
-
 264
264 -
 265
265 -
 266
266 -
 267
267 -
 268
268 -
 269
269 -
 270
270 -
 271
271 -
 272
272 -
 273
273 -
 274
274 -
 275
275 -
 276
276 -
 277
277 -
 278
278 -
 279
279 -
 280
280 -
 281
281 -
 282
282 -
 283
283 -
 284
284 -
285
-
286
-
287
-
288
-
289
-
290
-
291
-
292
-
293
-
294
-
295
-
296
-
297
-
298
-
299
-
300
 |
 |

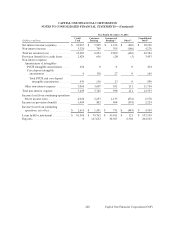
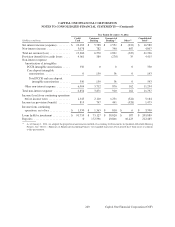
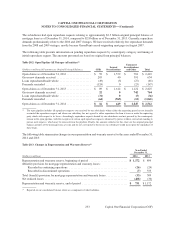
The following table presents the original principal balance of mortgage loan originations, by vintage for 2005 through
2008, for the three general categories of purchasers of mortgage loans and the estimated unpaid principal balance
as of December 31, 2014 and 2013:
Table 20.1: Unpaid Principal Balance of Mortgage Loans Originated and Sold to Third Parties Based on Category of
Purchaser
Estimated
Unpaid Principal Balance Original Principal Balance
December 31, December 31,
(Dollars in billions) 2014 2013 Total 2008 2007 2006 2005
GSEs . . . . . . . . . . . . . . . . . . . . . . . . . . . . . . . . $ 3 $ 3 $ 11 $ 1 $ 4 $ 3 $ 3
Insured Securitizations . . . . . . . . . . . . . . . . . . 45 20 0 2 8 10
Uninsured Securitizations and Other . . . . . . . . 16 18 80 3 15 30 32
Total . . . . . . . . . . . . . . . . . . . . . . . . . . . . . . . . . $ 23 $ 26 $111 $ 4 $ 21 $ 41 $ 45
Between 2005 and 2008, our subsidiaries sold an aggregate amount of $11 billion in original principal balance
mortgage loans to the GSEs.
Of the $20 billion in original principal balance of mortgage loans sold directly by our subsidiaries to private-label
purchasers who placed the loans into securitizations supported by bond insurance (“Insured Securitizations”),
approximately 48% of the original principal balance was covered by bond insurance. Further, approximately $16
billion original principal balance was placed in securitizations as to which the monoline bond insurers have made
repurchase requests or loan file requests to one of our subsidiaries (“Active Insured Securitizations”) and the remaining
approximately $4 billion original principal balance was placed in securitizations as to which the monoline bond
insurers have not made repurchase requests or loan file requests to one of our subsidiaries (“Inactive Insured
Securitizations”). Insured Securitizations often allow the monoline bond insurer to act independently of the investors.
Bond insurers typically have indemnity agreements directly with both the mortgage originators and the securitizers,
and they often have super-majority rights within the trust documentation that allow them to direct trustees to pursue
mortgage repurchase requests without coordination with other investors.
Because we do not service most of the loans our subsidiaries sold to others, we do not have complete information
about the current ownership of a portion of the $80 billion in original principal balance of mortgage loans not sold
directly to GSEs or placed in Insured Securitizations. We have determined based on information obtained from third-
party databases that about $48 billion original principal balance of these mortgage loans is currently held by
private-label publicly issued securitizations not supported by bond insurance (“Uninsured Securitizations”). An
additional approximately $22 billion original principal balance of mortgage loans were initially sold to private
investors as whole loans. Various known and unknown investors purchased the remaining $10 billion original
principal balance of mortgage loans.
With respect to the $111 billion in original principal balance of mortgage loans originated and sold to others between
2005 and 2008, we estimate that approximately $23 billion in unpaid principal balance remains outstanding as of
December 31, 2014, of which approximately $5 billion in unpaid principal balance is at least 90 days delinquent.
Approximately $21 billion in losses have been realized by third parties. Because we do not service most of the loans
we sold to others, we do not have complete information about the underlying credit performance levels for some of
these mortgage loans. These amounts reflect our best estimates, including extrapolations of underlying credit
performance where necessary. These estimates could change as we get additional data or refine our analysis.
252
CAPITAL ONE FINANCIAL CORPORATION
NOTES TO CONSOLIDATED FINANCIAL STATEMENTS—(Continued)
Capital One Financial Corporation (COF)