Capital One 2014 Annual Report Download - page 63
Download and view the complete annual report
Please find page 63 of the 2014 Capital One annual report below. You can navigate through the pages in the report by either clicking on the pages listed below, or by using the keyword search tool below to find specific information within the annual report.-
 1
1 -
2
-
3
-
4
-
5
-
6
-
7
-
8
-
9
-
10
-
11
-
12
-
13
-
14
-
15
-
16
-
17
-
18
-
19
-
20
-
21
-
22
-
23
-
24
-
25
-
26
-
27
-
28
-
29
-
30
-
31
-
32
-
33
-
34
-
35
-
36
-
37
-
38
-
39
-
40
-
41
-
42
-
43
-
44
-
45
-
46
-
47
-
48
-
49
-
50
-
51
-
52
-
 53
53 -
 54
54 -
 55
55 -
 56
56 -
 57
57 -
 58
58 -
 59
59 -
 60
60 -
 61
61 -
 62
62 -
 63
63 -
 64
64 -
 65
65 -
 66
66 -
 67
67 -
 68
68 -
 69
69 -
 70
70 -
 71
71 -
 72
72 -
 73
73 -
74
-
75
-
76
-
77
-
78
-
79
-
80
-
81
-
82
-
83
-
84
-
85
-
86
-
87
-
88
-
89
-
90
-
91
-
92
-
93
-
94
-
95
-
96
-
97
-
98
-
99
-
100
-
101
-
102
-
103
-
104
-
105
-
106
-
107
-
108
-
109
-
110
-
111
-
112
-
113
-
114
-
115
-
116
-
117
-
118
-
119
-
120
-
121
-
122
-
123
-
124
-
125
-
126
-
127
-
128
-
129
-
130
-
131
-
132
-
133
-
134
-
135
-
136
-
137
-
138
-
139
-
140
-
141
-
142
-
143
-
144
-
145
-
146
-
147
-
148
-
149
-
150
-
151
-
152
-
153
-
154
-
155
-
156
-
157
-
158
-
159
-
160
-
161
-
162
-
163
-
164
-
165
-
166
-
167
-
168
-
169
-
170
-
171
-
172
-
173
-
174
-
175
-
176
-
177
-
178
-
179
-
180
-
181
-
182
-
183
-
184
-
185
-
186
-
187
-
188
-
189
-
190
-
191
-
192
-
193
-
194
-
195
-
196
-
197
-
198
-
199
-
200
-
201
-
202
-
203
-
204
-
205
-
206
-
207
-
208
-
209
-
210
-
211
-
212
-
213
-
214
-
215
-
216
-
217
-
218
-
219
-
220
-
221
-
222
-
223
-
224
-
225
-
226
-
227
-
228
-
229
-
230
-
231
-
232
-
233
-
234
-
235
-
236
-
237
-
238
-
239
-
240
-
241
-
242
-
243
-
244
-
245
-
246
-
247
-
248
-
249
-
250
-
251
-
252
-
253
-
254
-
255
-
256
-
257
-
258
-
259
-
260
-
261
-
262
-
263
-
264
-
265
-
266
-
267
-
268
-
269
-
270
-
271
-
272
-
273
-
274
-
275
-
276
-
277
-
278
-
279
-
280
-
281
-
282
-
283
-
284
-
285
-
286
-
287
-
288
-
289
-
290
-
291
-
292
-
293
-
294
-
295
-
296
-
297
-
298
-
299
-
300
 |
 |

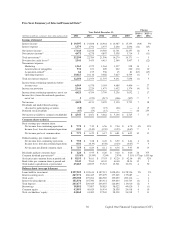
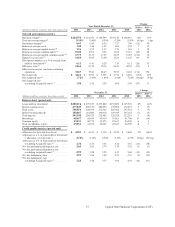
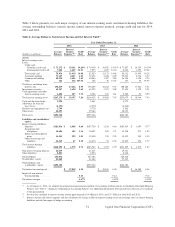
Business Segment Financial Performance
Table 1 summarizes our business segment results, which we report based on income from continuing operations,
net of tax, for the years ended December 31, 2014, 2013 and 2012. We provide information on the allocation
methodologies used to derive our business segment results in “Note 19—Business Segments.”
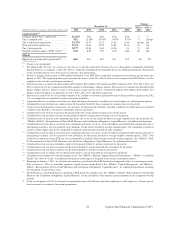
Table 1: Business Segment Results(1)
Year Ended December 31,
2014 2013 2012
Total Net Total Net Income Total Net
Revenue(2) Income(3) Revenue(2) (Loss)(3) Revenue(2) Income(3)
% of % of % of % of % of % of
(Dollars in millions) Amount Total Amount Total Amount Total Amount Total Amount Total Amount Total
Credit Card . . . . . . . . . . . . . . $13,621 61% $ 2,479 56% $14,287 64% $2,615 60% $13,260 62% $1,530 41%
Consumer Banking . . . . . . . . 6,432 29 1,195 27 6,654 30 1,451 33 6,570 31 1,363 37
Commercial Banking(4) . . . . . 2,201 10 659 15 2,069 9 731 17 1,891 9 810 22
Other(5) . . . . . . . . . . . . . . 36 — 90 2 (626) (3) (443) (10) (325) (2) 6 —
Total from continuing
operations . . . . . . . . . . . . . $22,290 100% $ 4,423 100% $22,384 100% $4,354 100% $21,396 100% $3,709 100%
(1) As of January 1, 2014, we adopted the proportional amortization method of accounting for Investments in Qualified Affordable Housing
Projects. See “Note 1—Summary of Significant Accounting Policies” for additional information. Prior periods have been recast to conform
to this presentation.
(2) Total net revenue consists of net interest income and non-interest income.
(3) Net income (loss) for our business segments is based on income (loss) from continuing operations, net of tax.
(4) Some of our tax-related commercial investments generate tax-exempt income or tax credits. Accordingly, we make certain reclassifications
within our Commercial Banking business results to present revenues and yields on a taxable-equivalent basis, calculated assuming an
effective tax rate approximately equal to our federal statutory tax rate of 35%.
(5) Includes the residual impact of the allocation of certain items, our centralized Corporate Treasury group activities, as well as other items as
described in “Note 19—Business Segments.”
•Credit Card: Our Credit Card business generated net income from continuing operations of $2.5 billion in 2014,
compared to net income from continuing operations of $2.6 billion in 2013. The decrease in net income was
driven by lower net revenue associated with the Portfolio Sale in 2013, partially offset by a decrease in non-
interest expenses and a lower provision for credit losses driven by lower net charge-offs. Period-end loans held
for investment in our Credit Card business increased by $4.6 billion to $85.9 billion as of December 31, 2014
from $81.3 billion as of December 31, 2013. The increase was primarily due to growth in the domestic card loan
portfolio in 2014.
•Consumer Banking: Our Consumer Banking business generated net income from continuing operations of $1.2
billion in 2014, compared to net income from continuing operations of $1.5 billion in 2013. The decrease in net
income was primarily attributable to compression in deposit spreads in retail banking, declining home loan
portfolio balances and margin compression in our auto loan portfolio. The decrease was partially offset by higher
net interest income generated by growth in our auto loan portfolio. Period-end loans held for investment in our
Consumer Banking business increased by $677 million to $71.4 billion as of December 31, 2014, from $70.8
billion as of December 31, 2013, due to growth in our auto loan portfolio outpacing the run-off in our acquired
home loan portfolio.
•Commercial Banking: Our Commercial Banking business generated net income from continuing operations of $659
million in 2014, compared to net income from continuing operations of $731 million in 2013. The decrease in net
income was primarily due to a higher provision for credit losses, reflecting an allowance build in 2014 compared
to an allowance release in 2013. This was partially offset by higher revenue net of related operating expenses, driven
by the growth in our commercial loan portfolio, fee-based services and products attributable to the Beech Street
business. Period-end loans held for investment in our Commercial Banking business increased by $5.9 billion to
$50.9 billion as of December 31, 2014, from $45.0 billion as of December 31, 2013. The increase was driven by
loan growth in the commercial and industrial and commercial and multifamily real estate portfolios.
41 Capital One Financial Corporation (COF)