Capital One 2014 Annual Report Download - page 216
Download and view the complete annual report
Please find page 216 of the 2014 Capital One annual report below. You can navigate through the pages in the report by either clicking on the pages listed below, or by using the keyword search tool below to find specific information within the annual report.-
 1
1 -
2
-
3
-
4
-
5
-
6
-
7
-
8
-
9
-
10
-
11
-
12
-
13
-
14
-
15
-
16
-
17
-
18
-
19
-
20
-
21
-
22
-
23
-
24
-
25
-
26
-
27
-
28
-
29
-
30
-
31
-
32
-
33
-
34
-
35
-
36
-
37
-
38
-
39
-
40
-
41
-
42
-
43
-
44
-
45
-
46
-
47
-
48
-
49
-
50
-
51
-
52
-
53
-
54
-
55
-
56
-
57
-
58
-
59
-
60
-
61
-
62
-
63
-
64
-
65
-
66
-
67
-
68
-
69
-
70
-
71
-
72
-
73
-
74
-
75
-
76
-
77
-
78
-
79
-
80
-
81
-
82
-
83
-
84
-
85
-
86
-
87
-
88
-
89
-
90
-
91
-
92
-
93
-
94
-
95
-
96
-
97
-
98
-
99
-
100
-
101
-
102
-
103
-
104
-
105
-
106
-
107
-
108
-
109
-
110
-
111
-
112
-
113
-
114
-
115
-
116
-
117
-
118
-
119
-
120
-
121
-
122
-
123
-
124
-
125
-
126
-
127
-
128
-
129
-
130
-
131
-
132
-
133
-
134
-
135
-
136
-
137
-
138
-
139
-
140
-
141
-
142
-
143
-
144
-
145
-
146
-
147
-
148
-
149
-
150
-
151
-
152
-
153
-
154
-
155
-
156
-
157
-
158
-
159
-
160
-
161
-
162
-
163
-
164
-
165
-
166
-
167
-
168
-
169
-
170
-
171
-
172
-
173
-
174
-
175
-
176
-
177
-
178
-
179
-
180
-
181
-
182
-
183
-
184
-
185
-
186
-
187
-
188
-
189
-
190
-
191
-
192
-
193
-
194
-
195
-
196
-
197
-
198
-
199
-
200
-
201
-
202
-
203
-
204
-
205
-
 206
206 -
 207
207 -
 208
208 -
 209
209 -
 210
210 -
 211
211 -
 212
212 -
 213
213 -
 214
214 -
 215
215 -
 216
216 -
 217
217 -
 218
218 -
 219
219 -
 220
220 -
 221
221 -
 222
222 -
 223
223 -
 224
224 -
 225
225 -
 226
226 -
227
-
228
-
229
-
230
-
231
-
232
-
233
-
234
-
235
-
236
-
237
-
238
-
239
-
240
-
241
-
242
-
243
-
244
-
245
-
246
-
247
-
248
-
249
-
250
-
251
-
252
-
253
-
254
-
255
-
256
-
257
-
258
-
259
-
260
-
261
-
262
-
263
-
264
-
265
-
266
-
267
-
268
-
269
-
270
-
271
-
272
-
273
-
274
-
275
-
276
-
277
-
278
-
279
-
280
-
281
-
282
-
283
-
284
-
285
-
286
-
287
-
288
-
289
-
290
-
291
-
292
-
293
-
294
-
295
-
296
-
297
-
298
-
299
-
300
 |
 |
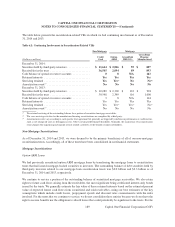
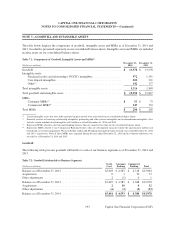
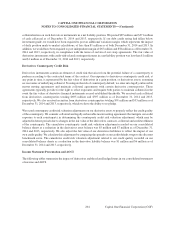
Goodwill was not impaired as of December 31, 2014 or 2013, nor was any goodwill written off due to
impairment during 2014, 2013 or 2012. The goodwill impairment test, performed at October 1 of each year, is
a two-step test. The first step identifies whether there is potential impairment by comparing the fair value of a
reporting unit to its carrying amount, including goodwill. If the fair value of a reporting unit is less than its
carrying amount, the second step of the impairment test is required to measure the amount of any potential
impairment loss.
The fair value of reporting units is calculated using a discounted cash flow model, a form of the income approach.
The model uses projected cash flows based on each reporting unit’s internal forecast and uses the perpetuity growth
method to calculate terminal values. These cash flows and terminal values are then discounted using appropriate
discount rates, which are largely based on our external cost of equity with adjustments for risk inherent in each
reporting unit. Cash flows are adjusted, as necessary, in order to maintain each reporting unit’s equity capital
requirements. Our discounted cash flow analysis requires management to make judgments about future loan and
deposit growth, revenue growth, credit losses, and capital rates. Discount rates used in 2014 for the reporting units
ranged from 8% to 13%. The key inputs into the discounted cash flow analysis were consistent with market data,
where available, indicating that assumptions used were within a reasonable range of observable market data. Based
on our analysis, fair value exceeded the carrying amount for all reporting units as of our annual testing date; therefore,
the second step of impairment testing was unnecessary.
As part of the annual goodwill impairment test, we also assessed our market capitalization based on the average
market price relative to the aggregate fair value of our reporting units and determined that any excess fair value in
our reporting units at that time could be attributed to a reasonable control premium compared to historical control
premiums seen in the industry.
We calculated the carrying amounts of our reporting units using an allocated economic capital approach based on
each reporting unit’s specific regulatory capital, economic capital requirements and underlying risks. The total of
the reporting unit carrying values for the October 1, 2014 annual goodwill impairment test was $34.9 billion,
compared to consolidated equity of $44.0 billion as of September 30, 2014. Of the $9.1 billion remaining equity,
$7.2 billion was primarily attributable to the following items: capital allocated to our Other category, preferred stock,
and capital that was reserved for dividends and share buy-backs that occurred during the fourth quarter of 2014.
The remaining unallocated equity of approximately $1.9 billion, which represented approximately 4% of our total
equity, has been reserved for potential future capital needs.
We will continue to regularly monitor our market capitalization and capital allocations in 2015, overall economic
conditions and other events or circumstances that may result in an impairment of goodwill in the future.
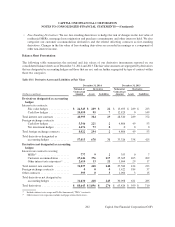
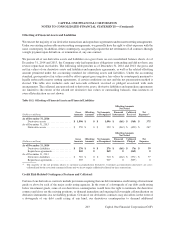
Intangible Assets
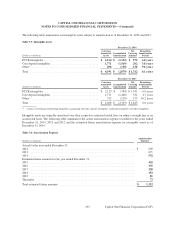
In connection with our acquisitions, we recorded intangible assets which include PCCR intangibles, core deposit
intangibles, brokerage relations intangibles, partnership contract intangibles, other contract intangibles, trademark
intangibles and other intangibles, which are subject to amortization. At acquisition, the PCCR intangibles reflect the
estimated value of existing credit card holder relationships and the core deposit intangibles reflect the estimated value
of deposit relationships. We did not record any impairment on intangible assets during 2014 or 2013.
194
CAPITAL ONE FINANCIAL CORPORATION
NOTES TO CONSOLIDATED FINANCIAL STATEMENTS—(Continued)
Capital One Financial Corporation (COF)