Capital One 2014 Annual Report Download - page 93
Download and view the complete annual report
Please find page 93 of the 2014 Capital One annual report below. You can navigate through the pages in the report by either clicking on the pages listed below, or by using the keyword search tool below to find specific information within the annual report.-
 1
1 -
2
-
3
-
4
-
5
-
6
-
7
-
8
-
9
-
10
-
11
-
12
-
13
-
14
-
15
-
16
-
17
-
18
-
19
-
20
-
21
-
22
-
23
-
24
-
25
-
26
-
27
-
28
-
29
-
30
-
31
-
32
-
33
-
34
-
35
-
36
-
37
-
38
-
39
-
40
-
41
-
42
-
43
-
44
-
45
-
46
-
47
-
48
-
49
-
50
-
51
-
52
-
53
-
54
-
55
-
56
-
57
-
58
-
59
-
60
-
61
-
62
-
63
-
64
-
65
-
66
-
67
-
68
-
69
-
70
-
71
-
72
-
73
-
74
-
75
-
76
-
77
-
78
-
79
-
80
-
81
-
82
-
 83
83 -
 84
84 -
 85
85 -
 86
86 -
 87
87 -
 88
88 -
 89
89 -
 90
90 -
 91
91 -
 92
92 -
 93
93 -
 94
94 -
 95
95 -
 96
96 -
 97
97 -
 98
98 -
 99
99 -
 100
100 -
 101
101 -
 102
102 -
 103
103 -
104
-
105
-
106
-
107
-
108
-
109
-
110
-
111
-
112
-
113
-
114
-
115
-
116
-
117
-
118
-
119
-
120
-
121
-
122
-
123
-
124
-
125
-
126
-
127
-
128
-
129
-
130
-
131
-
132
-
133
-
134
-
135
-
136
-
137
-
138
-
139
-
140
-
141
-
142
-
143
-
144
-
145
-
146
-
147
-
148
-
149
-
150
-
151
-
152
-
153
-
154
-
155
-
156
-
157
-
158
-
159
-
160
-
161
-
162
-
163
-
164
-
165
-
166
-
167
-
168
-
169
-
170
-
171
-
172
-
173
-
174
-
175
-
176
-
177
-
178
-
179
-
180
-
181
-
182
-
183
-
184
-
185
-
186
-
187
-
188
-
189
-
190
-
191
-
192
-
193
-
194
-
195
-
196
-
197
-
198
-
199
-
200
-
201
-
202
-
203
-
204
-
205
-
206
-
207
-
208
-
209
-
210
-
211
-
212
-
213
-
214
-
215
-
216
-
217
-
218
-
219
-
220
-
221
-
222
-
223
-
224
-
225
-
226
-
227
-
228
-
229
-
230
-
231
-
232
-
233
-
234
-
235
-
236
-
237
-
238
-
239
-
240
-
241
-
242
-
243
-
244
-
245
-
246
-
247
-
248
-
249
-
250
-
251
-
252
-
253
-
254
-
255
-
256
-
257
-
258
-
259
-
260
-
261
-
262
-
263
-
264
-
265
-
266
-
267
-
268
-
269
-
270
-
271
-
272
-
273
-
274
-
275
-
276
-
277
-
278
-
279
-
280
-
281
-
282
-
283
-
284
-
285
-
286
-
287
-
288
-
289
-
290
-
291
-
292
-
293
-
294
-
295
-
296
-
297
-
298
-
299
-
300
 |
 |

restructuring charges; a portion of the net provision for representation and warranty losses related to continuing
operations; certain material items that are non-recurring in nature; and offsets related to certain line-item
reclassifications.
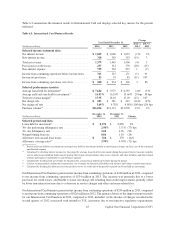
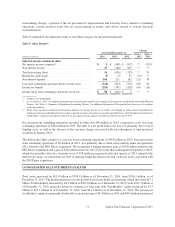
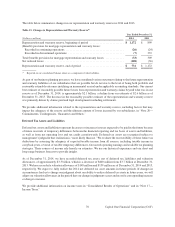
Table 9 summarizes the financial results of our Other category for the periods indicated.
Table 9: Other Results(1)
Change
Year Ended December 31, 2014 vs. 2013 vs.
(Dollars in millions) 2014 2013 2012 2013 2012
Selected income statement data:
Net interest income (expense)
(2) . . . . . . . . . . . . . . . . . . . . . . . $9
$ (440) $ (932) ** (53)%
Non-interest income . . . . . . . . . . . . . . . . . . . . . . . . . . . . . . . .
27
(186) 607 ** **
Total net revenue (loss) . . . . . . . . . . . . . . . . . . . . . . . . . . . . . .
36
(626) (325) ** 93
Benefit for credit losses . . . . . . . . . . . . . . . . . . . . . . . . . . . . . .
(5)
(3) 35 67% **
Non-interest expense . . . . . . . . . . . . . . . . . . . . . . . . . . . . . . . .
165
211 162 (22) 30
Loss from continuing operations before income taxes . . . . . .
(124)
(834) (522) (85) 60
Income tax benefit . . . . . . . . . . . . . . . . . . . . . . . . . . . . . . . . . .
(214)
(391) (528) (45) (26)
Income (loss) from continuing operations, net of tax . . . . . . .
$ 90
$ (443) $ 6 ** **
** Change is not meaningful.
(1) As of January 1, 2014, we adopted the proportional amortization method of accounting for Investments in Qualified Affordable Housing
Projects. See “Note 1—Summary of Significant Accounting Policies” for additional information. Prior periods have been recast to conform
to this presentation.
(2) Some of our tax-related commercial investments generate tax-exempt income or tax credits, accordingly we make certain reclassifications
within our Commercial Banking business results to present revenues and yields on a taxable-equivalent basis, with offsetting reclassifications
within Other, calculated assuming an effective tax rate approximately equal to our federal statutory tax rate of 35%.
Net income from continuing operations recorded in Other was $90 million in 2014, compared to a net loss from
continuing operations of $443 million in 2013. The shift to a net profit from a net loss was primarily due to lower
funding costs, as well as the absence of the one-time charge associated with our redemption of trust preferred
securities in January 2013.
The shift in the Other category to a net loss from continuing operations of $443 million in 2013, from net income
from continuing operations of $6 million in 2012, was primarily due to three non-recurring items recognized in
2012 related to the ING Direct acquisition. We recognized a bargain purchase gain of $594 million related to the
ING Direct acquisition and a gain of $162 million from the sale of Visa stock shares during the first quarter of 2012,
which was partially offset by a derivative loss of $78 million recognized in the first quarter of 2012 related to the
interest rate swaps we entered into in 2011 to partially hedge the interest rate risk of the net assets associated with
the ING Direct acquisition.
CONSOLIDATED BALANCE SHEETS ANALYSIS
Total assets increased by $12.0 billion to $308.9 billion as of December 31, 2014, from $296.9 billion, as of
December 31, 2013. The predominant area of asset growth was in loans held for investment, which increased $11.1
billion. Total liabilities increased by $8.5 billion to $263.8 billion as of December 31, 2014, from $255.3 billion as
of December 31, 2013, primarily driven by issuances of long-term debt. Stockholders’ equity increased by $3.5
billion to $45.1 billion as of December 31, 2014, from $41.6 billion as of December 31, 2013. The increase in
stockholders’ equity was primarily attributable to our net income of $4.4 billion in 2014 and $969 million in preferred
71 Capital One Financial Corporation (COF)