Capital One 2014 Annual Report Download - page 81
Download and view the complete annual report
Please find page 81 of the 2014 Capital One annual report below. You can navigate through the pages in the report by either clicking on the pages listed below, or by using the keyword search tool below to find specific information within the annual report.-
 1
1 -
2
-
3
-
4
-
5
-
6
-
7
-
8
-
9
-
10
-
11
-
12
-
13
-
14
-
15
-
16
-
17
-
18
-
19
-
20
-
21
-
22
-
23
-
24
-
25
-
26
-
27
-
28
-
29
-
30
-
31
-
32
-
33
-
34
-
35
-
36
-
37
-
38
-
39
-
40
-
41
-
42
-
43
-
44
-
45
-
46
-
47
-
48
-
49
-
50
-
51
-
52
-
53
-
54
-
55
-
56
-
57
-
58
-
59
-
60
-
61
-
62
-
63
-
64
-
65
-
66
-
67
-
68
-
69
-
70
-
 71
71 -
 72
72 -
 73
73 -
 74
74 -
 75
75 -
 76
76 -
 77
77 -
 78
78 -
 79
79 -
 80
80 -
 81
81 -
 82
82 -
 83
83 -
 84
84 -
 85
85 -
 86
86 -
 87
87 -
 88
88 -
 89
89 -
 90
90 -
 91
91 -
92
-
93
-
94
-
95
-
96
-
97
-
98
-
99
-
100
-
101
-
102
-
103
-
104
-
105
-
106
-
107
-
108
-
109
-
110
-
111
-
112
-
113
-
114
-
115
-
116
-
117
-
118
-
119
-
120
-
121
-
122
-
123
-
124
-
125
-
126
-
127
-
128
-
129
-
130
-
131
-
132
-
133
-
134
-
135
-
136
-
137
-
138
-
139
-
140
-
141
-
142
-
143
-
144
-
145
-
146
-
147
-
148
-
149
-
150
-
151
-
152
-
153
-
154
-
155
-
156
-
157
-
158
-
159
-
160
-
161
-
162
-
163
-
164
-
165
-
166
-
167
-
168
-
169
-
170
-
171
-
172
-
173
-
174
-
175
-
176
-
177
-
178
-
179
-
180
-
181
-
182
-
183
-
184
-
185
-
186
-
187
-
188
-
189
-
190
-
191
-
192
-
193
-
194
-
195
-
196
-
197
-
198
-
199
-
200
-
201
-
202
-
203
-
204
-
205
-
206
-
207
-
208
-
209
-
210
-
211
-
212
-
213
-
214
-
215
-
216
-
217
-
218
-
219
-
220
-
221
-
222
-
223
-
224
-
225
-
226
-
227
-
228
-
229
-
230
-
231
-
232
-
233
-
234
-
235
-
236
-
237
-
238
-
239
-
240
-
241
-
242
-
243
-
244
-
245
-
246
-
247
-
248
-
249
-
250
-
251
-
252
-
253
-
254
-
255
-
256
-
257
-
258
-
259
-
260
-
261
-
262
-
263
-
264
-
265
-
266
-
267
-
268
-
269
-
270
-
271
-
272
-
273
-
274
-
275
-
276
-
277
-
278
-
279
-
280
-
281
-
282
-
283
-
284
-
285
-
286
-
287
-
288
-
289
-
290
-
291
-
292
-
293
-
294
-
295
-
296
-
297
-
298
-
299
-
300
 |
 |
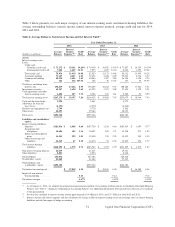
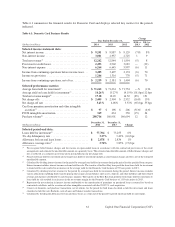
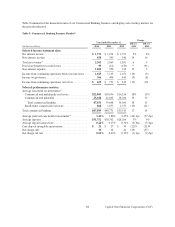
Key factors affecting the results of our Credit Card business for 2014, compared to 2013, and changes in financial
condition and credit performance between December 31, 2014 and December 31, 2013 include the following:
•Net Interest Income: Net interest income decreased by $657 million, or 6%, to $10.3 billion in 2014, compared
to $11.0 billion in 2013. The decrease in net interest income was primarily driven by the Portfolio Sale in the
third quarter of 2013.
•Non-Interest Income: Non-interest income was $3.3 billion in both 2014 and 2013. During 2014 there was an
increase in interchange fees, net driven by higher purchase volumes, offset by a reduction in service charges
and other customer-related fees due to strategic choices we made in our Domestic Card business.
•Provision for Credit Losses: The provision for credit losses decreased by $74 million, or 3%, to $2.8 billion in
2014. The decrease was due to lower net charge-offs, partially offset by an absence of a release in the allowance
for loan and lease losses that was incurred in 2013 related to the domestic card loan portfolio.
•Non-Interest Expense: Non-interest expense decreased by $376 million, or 5%, to $7.1 billion in 2014, compared
to $7.4 billion in 2013. The decrease was largely due to (i) lower acquisition related costs; (ii) lower operating
expenses driven by the Portfolio Sale; (iii) operating efficiencies; and (iv) lower provision for litigation matters;
partially offset by higher marketing expenses. Non-interest expense also included PCCR intangible amortization
of $369 million in 2014, compared to $434 million in 2013.
•Loans Held for Investment: Period-end loans held for investment increased by $4.6 billion, or 6%, to $85.9
billion as of December 31, 2014, from $81.3 billion as of December 31, 2013. This increase was primarily
driven by growth in the domestic card loan portfolio. Average loans held for investment decreased by $261
million, or less than 1%, to $78.9 billion in 2014, compared to $79.2 billion in 2013 due to the run-off of certain
loans acquired in the 2012 U.S. card acquisition, as well as the Portfolio Sale in 2013, partially offset by growth
in the second half of 2014.
•Net Charge-off and Delinquency Statistics: Our net charge-off rate decreased to 3.46% in 2014, compared to
4.15% in 2013, largely due to continued economic improvement and portfolio seasoning. The 30+ day
delinquency rate decreased to 3.30% as of December 31, 2014, compared to 3.54% as of December 31, 2013,
due to lower delinquency inventories.
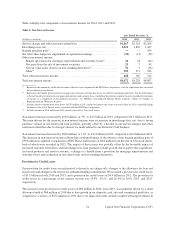
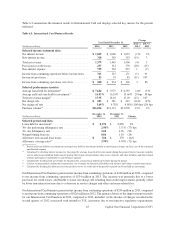
Key factors affecting the results of our Credit Card business for 2013, compared to 2012, and changes in financial
condition and credit performance between December 31, 2013 and December 31, 2012 include the following:
•Net Interest Income: Net interest income increased by $785 million, or 8%, to $11.0 billion in 2013,
compared to $10.2 billion in 2012. The increase in net interest income is primarily driven by (i) higher
average yield on loans held for investment; (ii) the increase in interest and non-interest income in 2013 due
to the full year impact of 2012 U.S. card acquisition; and (iii) the absence of the charge recorded in the
second quarter of 2012 to establish the finance charge and fee reserve for the loans acquired in the 2012
U.S card acquisition. The higher average yield on loans held for investment was driven largely by the transfer
of the Best Buy loan portfolio to the loans held for sale category in the first quarter of 2013. This was
partially offset by a decrease in average loans held for investment due to the Portfolio Sale and expected
continued run-off of our installment loan portfolio and other credit card loans acquired in the 2012 U.S.
card acquisition.
•Non-Interest Income: Non-interest income increased by $242 million, or 8%, to $3.3 billion in 2013, compared
to $3.1 billion in 2012. The increase was primarily driven by higher net interchange fees from growth in purchase
volume due in part to the 2012 U.S. card acquisition. Purchase volume increased by $20.5 billion, or 11%, in
2013. Other factors included increased customer-related fees from the addition of acquired credit card accounts
and the absence of charges incurred in the first and second quarters of 2012 for expected refunds to customers
affected by certain cross-sell sales practices in our Domestic Card business.
•Provision for Credit Losses: The provision for credit losses related to our Credit Card business decreased by
$1.3 billion, or 30%, to $2.8 billion in 2013, compared to $4.1 billion in 2012. The decrease was primarily
59 Capital One Financial Corporation (COF)