Capital One 2014 Annual Report Download - page 262
Download and view the complete annual report
Please find page 262 of the 2014 Capital One annual report below. You can navigate through the pages in the report by either clicking on the pages listed below, or by using the keyword search tool below to find specific information within the annual report.-
 1
1 -
2
-
3
-
4
-
5
-
6
-
7
-
8
-
9
-
10
-
11
-
12
-
13
-
14
-
15
-
16
-
17
-
18
-
19
-
20
-
21
-
22
-
23
-
24
-
25
-
26
-
27
-
28
-
29
-
30
-
31
-
32
-
33
-
34
-
35
-
36
-
37
-
38
-
39
-
40
-
41
-
42
-
43
-
44
-
45
-
46
-
47
-
48
-
49
-
50
-
51
-
52
-
53
-
54
-
55
-
56
-
57
-
58
-
59
-
60
-
61
-
62
-
63
-
64
-
65
-
66
-
67
-
68
-
69
-
70
-
71
-
72
-
73
-
74
-
75
-
76
-
77
-
78
-
79
-
80
-
81
-
82
-
83
-
84
-
85
-
86
-
87
-
88
-
89
-
90
-
91
-
92
-
93
-
94
-
95
-
96
-
97
-
98
-
99
-
100
-
101
-
102
-
103
-
104
-
105
-
106
-
107
-
108
-
109
-
110
-
111
-
112
-
113
-
114
-
115
-
116
-
117
-
118
-
119
-
120
-
121
-
122
-
123
-
124
-
125
-
126
-
127
-
128
-
129
-
130
-
131
-
132
-
133
-
134
-
135
-
136
-
137
-
138
-
139
-
140
-
141
-
142
-
143
-
144
-
145
-
146
-
147
-
148
-
149
-
150
-
151
-
152
-
153
-
154
-
155
-
156
-
157
-
158
-
159
-
160
-
161
-
162
-
163
-
164
-
165
-
166
-
167
-
168
-
169
-
170
-
171
-
172
-
173
-
174
-
175
-
176
-
177
-
178
-
179
-
180
-
181
-
182
-
183
-
184
-
185
-
186
-
187
-
188
-
189
-
190
-
191
-
192
-
193
-
194
-
195
-
196
-
197
-
198
-
199
-
200
-
201
-
202
-
203
-
204
-
205
-
206
-
207
-
208
-
209
-
210
-
211
-
212
-
213
-
214
-
215
-
216
-
217
-
218
-
219
-
220
-
221
-
222
-
223
-
224
-
225
-
226
-
227
-
228
-
229
-
230
-
231
-
232
-
233
-
234
-
235
-
236
-
237
-
238
-
239
-
240
-
241
-
242
-
243
-
244
-
245
-
246
-
247
-
248
-
249
-
250
-
251
-
 252
252 -
 253
253 -
 254
254 -
 255
255 -
 256
256 -
 257
257 -
 258
258 -
 259
259 -
 260
260 -
 261
261 -
 262
262 -
 263
263 -
 264
264 -
 265
265 -
 266
266 -
 267
267 -
 268
268 -
 269
269 -
 270
270 -
 271
271 -
 272
272 -
273
-
274
-
275
-
276
-
277
-
278
-
279
-
280
-
281
-
282
-
283
-
284
-
285
-
286
-
287
-
288
-
289
-
290
-
291
-
292
-
293
-
294
-
295
-
296
-
297
-
298
-
299
-
300
 |
 |

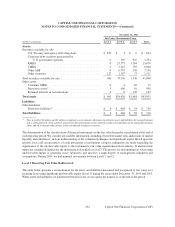
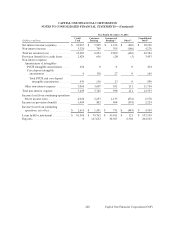
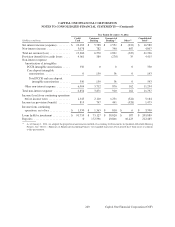
December 31, 2013 Estimated Fair Value Hierarchy
Carrying Estimated
(Dollars in millions) Amount Fair Value Level 1 Level 2 Level 3
Financial assets:
Cash and cash equivalents . . . . . . . . . . . . . . . . . . . . . . $ 6,291 $ 6,291 $ 6,291 $ 0 $ 0
Restricted cash for securitization investors . . . . . . . . . 874 874 874 0 0
Securities available for sale . . . . . . . . . . . . . . . . . . . . . 41,800 41,800 960 37,510 3,330
Securities held to maturity . . . . . . . . . . . . . . . . . . . . . . 19,132 19,185 0 18,895 290
Net loans held for investment . . . . . . . . . . . . . . . . . . . . 192,884 198,138 0 0 198,138
Loans held for sale . . . . . . . . . . . . . . . . . . . . . . . . . . . . 218 219 0 219 0
Interest receivable . . . . . . . . . . . . . . . . . . . . . . . . . . . . . 1,418 1,418 0 1,418 0
Derivatives assets . . . . . . . . . . . . . . . . . . . . . . . . . . . . . 959 959 3 906 50
Retained interests in securitizations . . . . . . . . . . . . . . . 199 199 0 0 199
Financial liabilities:
Non-interest bearing deposits . . . . . . . . . . . . . . . . . . . . $ 22,643 $ 22,643 $22,643 $ 0 $ 0
Interest-bearing deposits . . . . . . . . . . . . . . . . . . . . . . . . 181,880 175,516 0 14,346 161,170
Securitized debt obligations . . . . . . . . . . . . . . . . . . . . . 10,289 11,081 0 10,835 246
Senior and subordinated notes . . . . . . . . . . . . . . . . . . . 13,134 13,715 0 13,715 0
Federal funds purchased and securities loaned
or sold under agreements to repurchase . . . . . . . . . . 915 915 915 0 0
Other borrowings . . . . . . . . . . . . . . . . . . . . . . . . . . . . . 16,316 16,324 0 16,324 0
Interest payable . . . . . . . . . . . . . . . . . . . . . . . . . . . . . . . 307 307 0 307 0
Derivatives liabilities . . . . . . . . . . . . . . . . . . . . . . . . . . 710 710 4 668 38
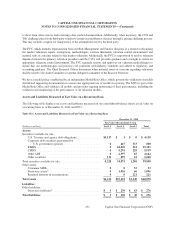
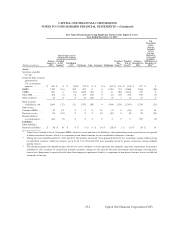
The following describes the valuation techniques used in estimating the fair value of our financial instruments as of
December 31, 2014 and 2013. We applied the fair value provisions to the financial instruments not recognized on the
consolidated balance sheets at fair value, which include securities held to maturity, loans held for investment, loans
held for sale, interest receivable, interest-bearing deposits, securitized debt obligations, other borrowings and senior
and subordinated notes. The provisions requiring us to maximize the use of observable inputs and to measure fair value
using a notion of exit price were factored into our selection of inputs for our established valuation techniques.
Financial Assets and Liabilities
Cash and Cash Equivalents
The carrying amounts of cash and due from banks, federal funds sold and securities purchased under agreements to
resell and interest-bearing deposits with banks approximate fair value.
Restricted Cash for Securitization Investors
The carrying amount of restricted cash for securitization investors approximates the fair value due to its relatively
short-term nature.
240
CAPITAL ONE FINANCIAL CORPORATION
NOTES TO CONSOLIDATED FINANCIAL STATEMENTS—(Continued)
Capital One Financial Corporation (COF)