Capital One 2014 Annual Report Download - page 115
Download and view the complete annual report
Please find page 115 of the 2014 Capital One annual report below. You can navigate through the pages in the report by either clicking on the pages listed below, or by using the keyword search tool below to find specific information within the annual report.-
 1
1 -
2
-
3
-
4
-
5
-
6
-
7
-
8
-
9
-
10
-
11
-
12
-
13
-
14
-
15
-
16
-
17
-
18
-
19
-
20
-
21
-
22
-
23
-
24
-
25
-
26
-
27
-
28
-
29
-
30
-
31
-
32
-
33
-
34
-
35
-
36
-
37
-
38
-
39
-
40
-
41
-
42
-
43
-
44
-
45
-
46
-
47
-
48
-
49
-
50
-
51
-
52
-
53
-
54
-
55
-
56
-
57
-
58
-
59
-
60
-
61
-
62
-
63
-
64
-
65
-
66
-
67
-
68
-
69
-
70
-
71
-
72
-
73
-
74
-
75
-
76
-
77
-
78
-
79
-
80
-
81
-
82
-
83
-
84
-
85
-
86
-
87
-
88
-
89
-
90
-
91
-
92
-
93
-
94
-
95
-
96
-
97
-
98
-
99
-
100
-
101
-
102
-
103
-
104
-
 105
105 -
 106
106 -
 107
107 -
 108
108 -
 109
109 -
 110
110 -
 111
111 -
 112
112 -
 113
113 -
 114
114 -
 115
115 -
 116
116 -
 117
117 -
 118
118 -
 119
119 -
 120
120 -
 121
121 -
 122
122 -
 123
123 -
 124
124 -
 125
125 -
126
-
127
-
128
-
129
-
130
-
131
-
132
-
133
-
134
-
135
-
136
-
137
-
138
-
139
-
140
-
141
-
142
-
143
-
144
-
145
-
146
-
147
-
148
-
149
-
150
-
151
-
152
-
153
-
154
-
155
-
156
-
157
-
158
-
159
-
160
-
161
-
162
-
163
-
164
-
165
-
166
-
167
-
168
-
169
-
170
-
171
-
172
-
173
-
174
-
175
-
176
-
177
-
178
-
179
-
180
-
181
-
182
-
183
-
184
-
185
-
186
-
187
-
188
-
189
-
190
-
191
-
192
-
193
-
194
-
195
-
196
-
197
-
198
-
199
-
200
-
201
-
202
-
203
-
204
-
205
-
206
-
207
-
208
-
209
-
210
-
211
-
212
-
213
-
214
-
215
-
216
-
217
-
218
-
219
-
220
-
221
-
222
-
223
-
224
-
225
-
226
-
227
-
228
-
229
-
230
-
231
-
232
-
233
-
234
-
235
-
236
-
237
-
238
-
239
-
240
-
241
-
242
-
243
-
244
-
245
-
246
-
247
-
248
-
249
-
250
-
251
-
252
-
253
-
254
-
255
-
256
-
257
-
258
-
259
-
260
-
261
-
262
-
263
-
264
-
265
-
266
-
267
-
268
-
269
-
270
-
271
-
272
-
273
-
274
-
275
-
276
-
277
-
278
-
279
-
280
-
281
-
282
-
283
-
284
-
285
-
286
-
287
-
288
-
289
-
290
-
291
-
292
-
293
-
294
-
295
-
296
-
297
-
298
-
299
-
300
 |
 |

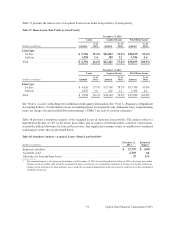
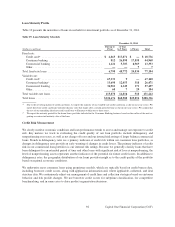
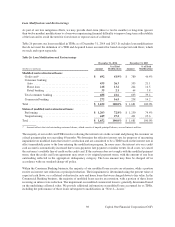
The following table provides details on the credit scores of our domestic credit card and auto loan portfolios.
Table 20: Credit Score Distribution
December 31, December 31,
(Percentage of portfolio with estimated credit scores) 2014 2013
Domestic credit card - Refreshed FICO scores:(1)
Greater than 660 . . . . . . . . . . . . . . . . . . . . . . . . . . . . . . . . . . . . . . . . . . . . . . . . . . . 68% 69%
660 or below . . . . . . . . . . . . . . . . . . . . . . . . . . . . . . . . . . . . . . . . . . . . . . . . . . . . . . 32 31
Total . . . . . . . . . . . . . . . . . . . . . . . . . . . . . . . . . . . . . . . . . . . . . . . . . . . . . . . . . . . . . . . . 100% 100%
Auto - At origination FICO scores:(2)
Greater than 660 . . . . . . . . . . . . . . . . . . . . . . . . . . . . . . . . . . . . . . . . . . . . . . . . . . . 47% 42%
621 - 660 . . . . . . . . . . . . . . . . . . . . . . . . . . . . . . . . . . . . . . . . . . . . . . . . . . . . . . . . . 17 17
620 or below . . . . . . . . . . . . . . . . . . . . . . . . . . . . . . . . . . . . . . . . . . . . . . . . . . . . . . 36 41
Total . . . . . . . . . . . . . . . . . . . . . . . . . . . . . . . . . . . . . . . . . . . . . . . . . . . . . . . . . . . . . . . . 100% 100%
(1) Credit scores generally represent FICO scores. These scores are obtained from one of the major credit bureaus at origination and are refreshed
monthly thereafter. We approximate non-FICO credit scores to comparable FICO scores for consistency. Balances for which no credit score
is available or the credit score is invalid are included in the 660 or below category.
(2) Credit scores represent FICO scores. These scores are obtained from three credit bureaus at the time of application and are not refreshed
thereafter. The FICO score distribution in the table above is based on the average scores. Balances for which no credit score is available or
the credit score is invalid are included in the 620 or below category.
We present information in the section below on the credit performance of our loan portfolio, including the key
metrics we use in tracking changes in the credit quality of our loan portfolio. We also present adjusted credit quality
metrics excluding the impact from Acquired Loans.
See “Note 4—Loans” in this Report for additional credit quality information. See “Note 1—Summary of Significant
Accounting Policies” for information on our accounting policies for delinquent, nonperforming loans, net charge-
offs and TDRs for each of our loan categories.
Delinquency Rates
We consider the entire balance of an account to be delinquent if the minimum required payment is not received by
the customer’s due date, measured at the reporting date. Our 30+ day delinquency metrics include all loans held for
investment that are 30 or more days past due, whereas our 30+ day performing delinquency metrics include loans
that are 30 or more days past due but currently classified as performing and accruing interest. The 30+ day
delinquency and 30+ day performing delinquency metrics are generally the same for credit card loans, as we continue
to classify the substantial majority of credit card loans as performing until the account is charged-off, typically when
the account is 180 days past due. See “Note 1—Summary of Significant Accounting Policies” for information on
our policies for classifying loans as nonperforming for each of our loan categories.
93 Capital One Financial Corporation (COF)