Capital One 2014 Annual Report Download - page 89
Download and view the complete annual report
Please find page 89 of the 2014 Capital One annual report below. You can navigate through the pages in the report by either clicking on the pages listed below, or by using the keyword search tool below to find specific information within the annual report.-
 1
1 -
2
-
3
-
4
-
5
-
6
-
7
-
8
-
9
-
10
-
11
-
12
-
13
-
14
-
15
-
16
-
17
-
18
-
19
-
20
-
21
-
22
-
23
-
24
-
25
-
26
-
27
-
28
-
29
-
30
-
31
-
32
-
33
-
34
-
35
-
36
-
37
-
38
-
39
-
40
-
41
-
42
-
43
-
44
-
45
-
46
-
47
-
48
-
49
-
50
-
51
-
52
-
53
-
54
-
55
-
56
-
57
-
58
-
59
-
60
-
61
-
62
-
63
-
64
-
65
-
66
-
67
-
68
-
69
-
70
-
71
-
72
-
73
-
74
-
75
-
76
-
77
-
78
-
 79
79 -
 80
80 -
 81
81 -
 82
82 -
 83
83 -
 84
84 -
 85
85 -
 86
86 -
 87
87 -
 88
88 -
 89
89 -
 90
90 -
 91
91 -
 92
92 -
 93
93 -
 94
94 -
 95
95 -
 96
96 -
 97
97 -
 98
98 -
 99
99 -
100
-
101
-
102
-
103
-
104
-
105
-
106
-
107
-
108
-
109
-
110
-
111
-
112
-
113
-
114
-
115
-
116
-
117
-
118
-
119
-
120
-
121
-
122
-
123
-
124
-
125
-
126
-
127
-
128
-
129
-
130
-
131
-
132
-
133
-
134
-
135
-
136
-
137
-
138
-
139
-
140
-
141
-
142
-
143
-
144
-
145
-
146
-
147
-
148
-
149
-
150
-
151
-
152
-
153
-
154
-
155
-
156
-
157
-
158
-
159
-
160
-
161
-
162
-
163
-
164
-
165
-
166
-
167
-
168
-
169
-
170
-
171
-
172
-
173
-
174
-
175
-
176
-
177
-
178
-
179
-
180
-
181
-
182
-
183
-
184
-
185
-
186
-
187
-
188
-
189
-
190
-
191
-
192
-
193
-
194
-
195
-
196
-
197
-
198
-
199
-
200
-
201
-
202
-
203
-
204
-
205
-
206
-
207
-
208
-
209
-
210
-
211
-
212
-
213
-
214
-
215
-
216
-
217
-
218
-
219
-
220
-
221
-
222
-
223
-
224
-
225
-
226
-
227
-
228
-
229
-
230
-
231
-
232
-
233
-
234
-
235
-
236
-
237
-
238
-
239
-
240
-
241
-
242
-
243
-
244
-
245
-
246
-
247
-
248
-
249
-
250
-
251
-
252
-
253
-
254
-
255
-
256
-
257
-
258
-
259
-
260
-
261
-
262
-
263
-
264
-
265
-
266
-
267
-
268
-
269
-
270
-
271
-
272
-
273
-
274
-
275
-
276
-
277
-
278
-
279
-
280
-
281
-
282
-
283
-
284
-
285
-
286
-
287
-
288
-
289
-
290
-
291
-
292
-
293
-
294
-
295
-
296
-
297
-
298
-
299
-
300
 |
 |
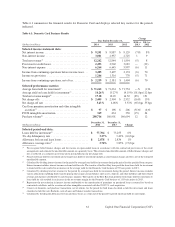
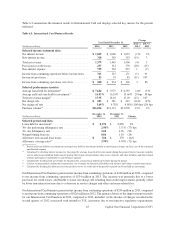
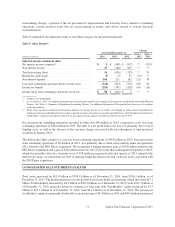
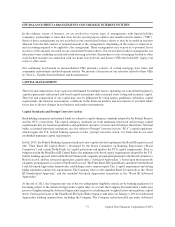
•Loans Held for Investment: Period-end loans held for investment in our Consumer Banking business declined
by $4.4 billion, or 6%, to $70.8 billion as of December 31, 2013, due to the run-off of our acquired home loan
portfolio, partially offset by higher period-end auto loan balances due to the continued high volume of auto
loan originations. Average loans held for investment increased by $631 million, or 1%, to $72.5 billion in 2013,
compared to $71.8 billion in 2012 due to growth in our auto loan portfolio outpacing the run-off in our acquired
home loan portfolio.
•Deposits: Period-end deposits in our Consumer Banking business declined by $4.7 billion, or 3%, to $167.7
billion as of December 31, 2013, primarily due to the expected run-off of our legacy National Direct Bank
deposits.
•Net Charge-off and Delinquency Statistics: The net charge-off rate increased to 0.85% in 2013, compared to
0.74% in 2012. The 30+ day delinquency rate increased to 3.89% as of December 31, 2013, from 3.34% as of
December 31, 2012. The increase in the net charge-off rates reflect moderately higher auto loan charge-offs,
partially offset by improved home loan performance. The overall delinquency rates increased moderately largely
due to the run-off of our acquired home loan portfolio, which were included in the denominator in calculating
the delinquency rates.
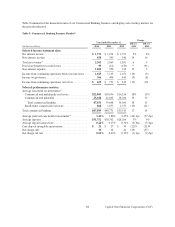
Commercial Banking Business
The primary sources of revenue for our Commercial Banking business are net interest income from loans and deposits
and non-interest income from customer fees and related transactions. Because we have some investments that
generate tax-exempt income or tax credits, we make certain reclassifications to our Commercial Banking business
results to present revenues on a taxable-equivalent basis. Expenses primarily consist of the provision for credit
losses, ongoing operating costs, such as salaries and associate benefits, occupancy, equipment, professional services,
communications and data processing expenses, as well as marketing expenses.
As of January 1, 2014, we adopted the proportional amortization method of accounting for Investments in Qualified
Affordable Housing Projects. The proportional amortization method amortizes the cost of the investment over the
period in which we will receive tax credits and other tax benefits, and the resulting amortization is recognized as a
component of income taxes attributable to continuing operations. Historically, these investments were accounted
for under the equity method of accounting and the passive losses related to the investments were recognized within
non-interest expense. See “Note 1—Summary of Significant Accounting Policies” for more information.
Our Commercial Banking business generated net income from continuing operations of $659 million, $731 million
and $810 million in 2014, 2013 and 2012, respectively.
67 Capital One Financial Corporation (COF)