Capital One 2014 Annual Report Download - page 204
Download and view the complete annual report
Please find page 204 of the 2014 Capital One annual report below. You can navigate through the pages in the report by either clicking on the pages listed below, or by using the keyword search tool below to find specific information within the annual report.-
 1
1 -
2
-
3
-
4
-
5
-
6
-
7
-
8
-
9
-
10
-
11
-
12
-
13
-
14
-
15
-
16
-
17
-
18
-
19
-
20
-
21
-
22
-
23
-
24
-
25
-
26
-
27
-
28
-
29
-
30
-
31
-
32
-
33
-
34
-
35
-
36
-
37
-
38
-
39
-
40
-
41
-
42
-
43
-
44
-
45
-
46
-
47
-
48
-
49
-
50
-
51
-
52
-
53
-
54
-
55
-
56
-
57
-
58
-
59
-
60
-
61
-
62
-
63
-
64
-
65
-
66
-
67
-
68
-
69
-
70
-
71
-
72
-
73
-
74
-
75
-
76
-
77
-
78
-
79
-
80
-
81
-
82
-
83
-
84
-
85
-
86
-
87
-
88
-
89
-
90
-
91
-
92
-
93
-
94
-
95
-
96
-
97
-
98
-
99
-
100
-
101
-
102
-
103
-
104
-
105
-
106
-
107
-
108
-
109
-
110
-
111
-
112
-
113
-
114
-
115
-
116
-
117
-
118
-
119
-
120
-
121
-
122
-
123
-
124
-
125
-
126
-
127
-
128
-
129
-
130
-
131
-
132
-
133
-
134
-
135
-
136
-
137
-
138
-
139
-
140
-
141
-
142
-
143
-
144
-
145
-
146
-
147
-
148
-
149
-
150
-
151
-
152
-
153
-
154
-
155
-
156
-
157
-
158
-
159
-
160
-
161
-
162
-
163
-
164
-
165
-
166
-
167
-
168
-
169
-
170
-
171
-
172
-
173
-
174
-
175
-
176
-
177
-
178
-
179
-
180
-
181
-
182
-
183
-
184
-
185
-
186
-
187
-
188
-
189
-
190
-
191
-
192
-
193
-
 194
194 -
 195
195 -
 196
196 -
 197
197 -
 198
198 -
 199
199 -
 200
200 -
 201
201 -
 202
202 -
 203
203 -
 204
204 -
 205
205 -
 206
206 -
 207
207 -
 208
208 -
 209
209 -
 210
210 -
 211
211 -
 212
212 -
 213
213 -
 214
214 -
215
-
216
-
217
-
218
-
219
-
220
-
221
-
222
-
223
-
224
-
225
-
226
-
227
-
228
-
229
-
230
-
231
-
232
-
233
-
234
-
235
-
236
-
237
-
238
-
239
-
240
-
241
-
242
-
243
-
244
-
245
-
246
-
247
-
248
-
249
-
250
-
251
-
252
-
253
-
254
-
255
-
256
-
257
-
258
-
259
-
260
-
261
-
262
-
263
-
264
-
265
-
266
-
267
-
268
-
269
-
270
-
271
-
272
-
273
-
274
-
275
-
276
-
277
-
278
-
279
-
280
-
281
-
282
-
283
-
284
-
285
-
286
-
287
-
288
-
289
-
290
-
291
-
292
-
293
-
294
-
295
-
296
-
297
-
298
-
299
-
300
 |
 |

182
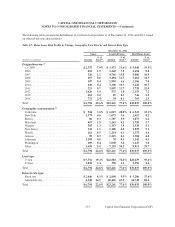
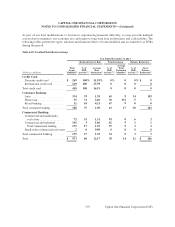
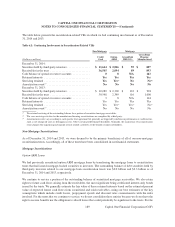
Acquired Loans Accounted for Based on Expected Cash Flows
Outstanding Balance and Carrying Value of Acquired Loans
The table below presents the outstanding balance and the carrying value of loans from the ING Direct, CCB and
2012 U.S. card acquisitions accounted for based on expected cash flows as of December 31, 2014 and 2013. The
table separately displays loans considered credit-impaired at acquisition and loans not considered credit-impaired
at acquisition.
Table 4.12: Acquired Loans Accounted for Based on Expected Cash Flows
December 31, 2014 December 31, 2013
Impaired Non-Impaired Impaired Non-Impaired
(Dollars in millions) Total Loans Loans Total Loans Loan
Outstanding balance . . . . . . . . . . . . . . . . . $25,201 $ 4,279 $ 20,922 $ 30,565 $ 5,016 $ 25,549
Carrying value(1) . . . . . . . . . . . . . . . . . . . . 23,519 2,882 20,637 28,580 3,285 25,295
(1) Includes $27 million and $38 million of allowance for loan and lease losses for these loans as of December 31, 2014 and 2013, respectively.
We recorded a $11 million and $19 million release of the allowance for loan and lease losses for the years ended December 31, 2014 and
2013, respectively, for certain pools of Acquired Loans.
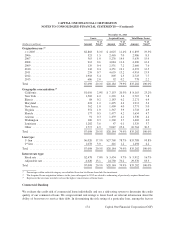
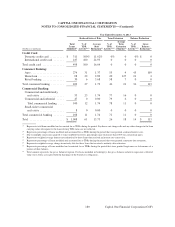
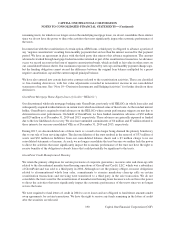
Changes in Accretable Yield
The following table presents changes in the accretable yield on loans related to the ING Direct, CCB and 2012 U.S.
card acquisitions:
Table 4.13: Changes in Accretable Yield on Acquired Loans
Total Impaired Non-Impaired
(Dollars in millions) Loans Loans Loans
Accretable yield as of December 31, 2012 . . . . . . . . . . . . . . . . . . . . . . . . . . $ 6,208 $ 1,899 $ 4,309
Accretion recognized in earnings . . . . . . . . . . . . . . . . . . . . . . . . . . . . . . . . . (1,182) (427) (755)
Reclassifications from nonaccretable difference for loans
with improving cash flows(1) . . . . . . . . . . . . . . . . . . . . . . . . . . . . . . . . . . . 1,005 629 376
Increases in accretable yield for non-credit related changes
in expected cash flows(2) . . . . . . . . . . . . . . . . . . . . . . . . . . . . . . . . . . . . . . 389 13 376
Accretable yield as of December 31, 2013 . . . . . . . . . . . . . . . . . . . . . . . . . . $ 6,420 $ 2,114 $ 4,306
Accretion recognized in earnings . . . . . . . . . . . . . . . . . . . . . . . . . . . . . . . . . (1,042) (379) (663)
Reclassifications from nonaccretable difference for loans
with improving cash flows(1) . . . . . . . . . . . . . . . . . . . . . . . . . . . . . . . . . . . 214 94 120
Reductions in accretable yield for non-credit related
changes in expected cash flows(2) . . . . . . . . . . . . . . . . . . . . . . . . . . . . . . . (939) (344) (595)
Accretable yield as of December 31, 2014 . . . . . . . . . . . . . . . . . . . . . . . . . . $ 4,653 $ 1,485 $ 3,168
(1) Represents increases in accretable yield for those loans in pools that are driven primarily by improved credit performance.
(2) Represents changes in accretable yield for those loans in pools that are driven primarily by changes in actual and estimated prepayments.
CAPITAL ONE FINANCIAL CORPORATION
NOTES TO CONSOLIDATED FINANCIAL STATEMENTS—(Continued)
Capital One Financial Corporation (COF)