Capital One 2014 Annual Report Download - page 101
Download and view the complete annual report
Please find page 101 of the 2014 Capital One annual report below. You can navigate through the pages in the report by either clicking on the pages listed below, or by using the keyword search tool below to find specific information within the annual report.-
 1
1 -
2
-
3
-
4
-
5
-
6
-
7
-
8
-
9
-
10
-
11
-
12
-
13
-
14
-
15
-
16
-
17
-
18
-
19
-
20
-
21
-
22
-
23
-
24
-
25
-
26
-
27
-
28
-
29
-
30
-
31
-
32
-
33
-
34
-
35
-
36
-
37
-
38
-
39
-
40
-
41
-
42
-
43
-
44
-
45
-
46
-
47
-
48
-
49
-
50
-
51
-
52
-
53
-
54
-
55
-
56
-
57
-
58
-
59
-
60
-
61
-
62
-
63
-
64
-
65
-
66
-
67
-
68
-
69
-
70
-
71
-
72
-
73
-
74
-
75
-
76
-
77
-
78
-
79
-
80
-
81
-
82
-
83
-
84
-
85
-
86
-
87
-
88
-
89
-
90
-
 91
91 -
 92
92 -
 93
93 -
 94
94 -
 95
95 -
 96
96 -
 97
97 -
 98
98 -
 99
99 -
 100
100 -
 101
101 -
 102
102 -
 103
103 -
 104
104 -
 105
105 -
 106
106 -
 107
107 -
 108
108 -
 109
109 -
 110
110 -
 111
111 -
112
-
113
-
114
-
115
-
116
-
117
-
118
-
119
-
120
-
121
-
122
-
123
-
124
-
125
-
126
-
127
-
128
-
129
-
130
-
131
-
132
-
133
-
134
-
135
-
136
-
137
-
138
-
139
-
140
-
141
-
142
-
143
-
144
-
145
-
146
-
147
-
148
-
149
-
150
-
151
-
152
-
153
-
154
-
155
-
156
-
157
-
158
-
159
-
160
-
161
-
162
-
163
-
164
-
165
-
166
-
167
-
168
-
169
-
170
-
171
-
172
-
173
-
174
-
175
-
176
-
177
-
178
-
179
-
180
-
181
-
182
-
183
-
184
-
185
-
186
-
187
-
188
-
189
-
190
-
191
-
192
-
193
-
194
-
195
-
196
-
197
-
198
-
199
-
200
-
201
-
202
-
203
-
204
-
205
-
206
-
207
-
208
-
209
-
210
-
211
-
212
-
213
-
214
-
215
-
216
-
217
-
218
-
219
-
220
-
221
-
222
-
223
-
224
-
225
-
226
-
227
-
228
-
229
-
230
-
231
-
232
-
233
-
234
-
235
-
236
-
237
-
238
-
239
-
240
-
241
-
242
-
243
-
244
-
245
-
246
-
247
-
248
-
249
-
250
-
251
-
252
-
253
-
254
-
255
-
256
-
257
-
258
-
259
-
260
-
261
-
262
-
263
-
264
-
265
-
266
-
267
-
268
-
269
-
270
-
271
-
272
-
273
-
274
-
275
-
276
-
277
-
278
-
279
-
280
-
281
-
282
-
283
-
284
-
285
-
286
-
287
-
288
-
289
-
290
-
291
-
292
-
293
-
294
-
295
-
296
-
297
-
298
-
299
-
300
 |
 |

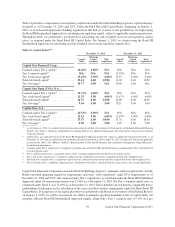
Table 14 provides a comparison of our regulatory capital ratios under the Federal Banking Agencies’ capital adequacy
standards as of December 31, 2014 and 2013. Under the Final Basel III Capital Rules, beginning on January 1,
2014, as an Advanced Approaches banking organization that had yet to enter or exit parallel run, we began using
the Basel III Standardized Approach for calculating our regulatory capital, subject to applicable transition provisions.
Throughout 2014, we continued to use Basel I for calculating our risk-weighted assets in our regulatory capital
ratios, as required under the Final Basel III Capital Rules. On January 1, 2015, we began using the Basel III
Standardized Approach for calculating our risk-weighted assets in our regulatory capital ratios.
Table 14: Capital Ratios(1)(2)
December 31, 2014 December 31, 2013
Minimum Minimum
Capital Capital Well- Capital Capital Well-
Ratio Adequacy Capitalized Ratio Adequacy Capitalized
Capital One Financial Corp:
Common equity Tier 1 capital
(3)
. . . . . . . . . . . .
12.46% 4.00% N/A
N/A N/A N/A
Tier 1 common capital
(4)
. . . . . . . . . . . . . . . . . .
N/A N/A N/A
12.19% N/A N/A
Tier 1 risk-based capital
(5)
. . . . . . . . . . . . . . . . .
13.23% 5.50% 6.00%
12.57 4.00% 6.00%
Total risk-based capital
(6)
. . . . . . . . . . . . . . . . .
15.14 8.00 10.00
14.69 8.00 10.00
Tier 1 leverage
(7)
. . . . . . . . . . . . . . . . . . . . . . . .
10.77 4.00 N/A
10.06 4.00 N/A
Capital One Bank (USA), N.A.:
Common equity Tier 1 capital
(3)
. . . . . . . . . . . .
11.33% 4.00% N/A
N/A N/A N/A
Tier 1 risk-based capital
(5)
. . . . . . . . . . . . . . . . .
11.33 5.50 6.00%
11.47% 4.00% 6.00%
Total risk-based capital
(6)
. . . . . . . . . . . . . . . . .
14.57 8.00 10.00
14.90 8.00 10.00
Tier 1 leverage
(7)
. . . . . . . . . . . . . . . . . . . . . . . .
9.64 4.00 5.00
10.21 4.00 5.00
Capital One, N.A.:
Common equity Tier 1 capital
(3)
. . . . . . . . . . . .
12.53% 4.00% N/A
N/A N/A N/A
Tier 1 risk-based capital
(5)
. . . . . . . . . . . . . . . . .
12.53 5.50 6.00%
12.67% 4.00% 6.00%
Total risk-based capital
(6)
. . . . . . . . . . . . . . . . .
13.57 8.00 10.00
13.76 8.00 10.00
Tier 1 leverage
(7)
. . . . . . . . . . . . . . . . . . . . . . . .
8.90 4.00 5.00
8.96 4.00 5.00
(1) As of January 1, 2014, we adopted the proportional amortization method of accounting for Investments in Qualified Affordable Housing
Projects. See “Note 1—Summary of Significant Accounting Policies” for additional information. Prior periods have been recast to conform
to this presentation.
(2) Capital ratios are calculated based on the Basel III Standardized Approach framework, subject to applicable transition provisions, as of
December 31, 2014 and are calculated based on the Basel I capital framework as of December 31, 2013. Capital ratios that are not applicable
are denoted by “N/A.” See “MD&A—Table F—Reconciliation of Non-GAAP Measures and Calculation of Regulatory Capital Measures”
for additional information.
(3) Common equity Tier 1 capital ratio is a regulatory capital measure under Basel III calculated based on common equity Tier 1 capital divided
by risk-weighted assets.
(4) Tier 1 common capital ratio is calculated based on Tier 1 common capital divided by Basel I risk-weighted assets.
(5) Tier 1 risk-based capital ratio is a regulatory capital measure calculated based on Tier 1 capital divided by risk-weighted assets.
(6) Total risk-based capital ratio is a regulatory capital measure calculated based on total risk-based capital divided by risk-weighted assets.
(7) Tier 1 leverage ratio is a regulatory capital measure calculated based on Tier 1 capital divided by average assets, after certain adjustments.
Capital One Financial Corporation exceeded Federal Banking Agencies’ minimum capital requirements and the
Banks exceeded minimum regulatory requirements and were “well-capitalized” under PCA requirements as of
December 31, 2014 and 2013. Our common equity Tier 1 capital ratio, as calculated under the Basel III Standardized
Approach, subject to transition provisions, was 12.46% as of December 31, 2014. Our Tier 1 common capital ratio, as
calculated under Basel I, was 12.19% as of December 31, 2013. These numbers are not directly comparable due to
methodological differences in the calculation of the ratios and the transition requirements under the Final Basel III
Capital Rules. For purposes of our capital plan that was submitted to the Board of Governors of the Federal Reserve
on January 5, 2015, we will be assessed on our ability to maintain specified minimum levels of capital under our
currently effective Basel III Standardized Approach regime, along with a Tier 1 common ratio of 5.0% on a pro
79 Capital One Financial Corporation (COF)