Capital One 2014 Annual Report Download - page 78
Download and view the complete annual report
Please find page 78 of the 2014 Capital One annual report below. You can navigate through the pages in the report by either clicking on the pages listed below, or by using the keyword search tool below to find specific information within the annual report.-
 1
1 -
2
-
3
-
4
-
5
-
6
-
7
-
8
-
9
-
10
-
11
-
12
-
13
-
14
-
15
-
16
-
17
-
18
-
19
-
20
-
21
-
22
-
23
-
24
-
25
-
26
-
27
-
28
-
29
-
30
-
31
-
32
-
33
-
34
-
35
-
36
-
37
-
38
-
39
-
40
-
41
-
42
-
43
-
44
-
45
-
46
-
47
-
48
-
49
-
50
-
51
-
52
-
53
-
54
-
55
-
56
-
57
-
58
-
59
-
60
-
61
-
62
-
63
-
64
-
65
-
66
-
67
-
 68
68 -
 69
69 -
 70
70 -
 71
71 -
 72
72 -
 73
73 -
 74
74 -
 75
75 -
 76
76 -
 77
77 -
 78
78 -
 79
79 -
 80
80 -
 81
81 -
 82
82 -
 83
83 -
 84
84 -
 85
85 -
 86
86 -
 87
87 -
 88
88 -
89
-
90
-
91
-
92
-
93
-
94
-
95
-
96
-
97
-
98
-
99
-
100
-
101
-
102
-
103
-
104
-
105
-
106
-
107
-
108
-
109
-
110
-
111
-
112
-
113
-
114
-
115
-
116
-
117
-
118
-
119
-
120
-
121
-
122
-
123
-
124
-
125
-
126
-
127
-
128
-
129
-
130
-
131
-
132
-
133
-
134
-
135
-
136
-
137
-
138
-
139
-
140
-
141
-
142
-
143
-
144
-
145
-
146
-
147
-
148
-
149
-
150
-
151
-
152
-
153
-
154
-
155
-
156
-
157
-
158
-
159
-
160
-
161
-
162
-
163
-
164
-
165
-
166
-
167
-
168
-
169
-
170
-
171
-
172
-
173
-
174
-
175
-
176
-
177
-
178
-
179
-
180
-
181
-
182
-
183
-
184
-
185
-
186
-
187
-
188
-
189
-
190
-
191
-
192
-
193
-
194
-
195
-
196
-
197
-
198
-
199
-
200
-
201
-
202
-
203
-
204
-
205
-
206
-
207
-
208
-
209
-
210
-
211
-
212
-
213
-
214
-
215
-
216
-
217
-
218
-
219
-
220
-
221
-
222
-
223
-
224
-
225
-
226
-
227
-
228
-
229
-
230
-
231
-
232
-
233
-
234
-
235
-
236
-
237
-
238
-
239
-
240
-
241
-
242
-
243
-
244
-
245
-
246
-
247
-
248
-
249
-
250
-
251
-
252
-
253
-
254
-
255
-
256
-
257
-
258
-
259
-
260
-
261
-
262
-
263
-
264
-
265
-
266
-
267
-
268
-
269
-
270
-
271
-
272
-
273
-
274
-
275
-
276
-
277
-
278
-
279
-
280
-
281
-
282
-
283
-
284
-
285
-
286
-
287
-
288
-
289
-
290
-
291
-
292
-
293
-
294
-
295
-
296
-
297
-
298
-
299
-
300
 |
 |
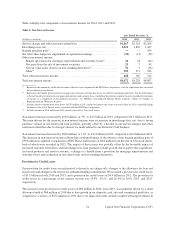
Non-interest expense decreased by $173 million, or 1%, to $12.2 billion in 2014, compared to $12.4 billion in 2013.
The decrease reflects a decline in the amortization of intangibles and a reduction in acquisition-related costs and
provision for litigation matters. These were partially offset by (i) higher operating expenses attributable to growth
in our commercial and auto loan portfolios; (ii) the change to include auto repossession-related expenses as a
component of operating expenses (prior to January 1, 2014 these costs were reported as a component of net charge-
offs); and (iii) higher marketing expenses associated with loan growth, partially offset by lower bankcard, regulatory
and other fee assessments and communications and data processing expenses.
Non-interest expense increased by $556 million, or 5%, to $12.4 billion in 2013, compared to $11.8 billion in 2012.
The increase reflects higher operating expenses attributable to the acquired businesses and the growth in our auto
loan and commercial loan portfolios. These increases were partially offset by a reduction in acquisition-related costs
and other non-interest expenses.
Income Taxes
We recorded income tax provisions of $2.1 billion (32.7% effective income tax rate), $2.2 billion (33.8% effective
income tax rate) and $1.5 billion (28.5% effective income tax rate) in 2014, 2013 and 2012, respectively. Our effective
tax rate on income from continuing operations varies between periods due, in part, to fluctuations in our pre-tax
earnings, which affects the relative tax benefit of tax-exempt income, tax credits and other permanent tax items.
The decrease in our effective income tax rate in 2014, from 2013, was primarily attributable to increased net tax
credits and tax exempt income, and reductions in state rates, partially offset by increased discrete tax expenses.
The increase in our effective income tax rate in 2013, from 2012, was primarily attributable to increased pre-tax
income, which reduced the relative benefit of tax-exempt income, tax credits and other permanent items, and the
absence of discrete tax benefits of $251 million recorded in 2012 for the non-taxable bargain purchase gain of $594
million related to the acquisition of ING Direct, a deferred tax benefit for changes in our state tax position resulting
from the 2012 U.S. card acquisition and consolidation of ING Bank, fsb with our existing banking operations, and
the resolution of certain tax issues and audits. In comparison, we recorded $16 million of discrete tax expense in
2013 primarily related to adjustments to acquired tax attributes based upon the final tax returns filed, changes to
enacted statutory tax rates, and resolution of certain tax issues and audits.
Our effective income tax rate, excluding the impact of discrete tax items discussed above, was 32.2% in 2014 and
33.6% in both 2013 and 2012. The lower effective income tax rate before discrete items in 2014 in comparison to
2013 was primarily due to higher affordable housing and other business tax credits as a percentage of pre-tax earnings.
We provide additional information on items affecting our income taxes and effective tax rate under “Note 17—Income
Taxes.”
Income (Loss) from Discontinued Operations, Net of Tax
Income (loss) from discontinued operations reflects ongoing costs, which primarily consist of mortgage loan
repurchase representation and warranty charges, related to the mortgage origination operations of GreenPoint’s
wholesale mortgage banking unit that we closed in 2007. Income from discontinued operations, net of tax, was $5
million in 2014, compared to a loss from discontinued operations of $233 million and $217 million in 2013 and
2012, respectively. We recorded a total pre-tax benefit for mortgage representation and warranty losses of $7
million ($4 million net of tax) in 2014, compared to a pre-tax provision for mortgage representation and warranty losses
of $333 million ($210 million net of tax) in 2013 and $307 million ($194 million net of tax) in 2012.
We provide additional information on the net provision for mortgage representation and warranty losses and the
related reserve for representation and warranty claims in “Consolidated Balance Sheets Analysis—Mortgage
Representation and Warranty Reserve” and “Note 20—Commitments, Contingencies, Guarantees and Others.”
56 Capital One Financial Corporation (COF)