Capital One 2014 Annual Report Download - page 75
Download and view the complete annual report
Please find page 75 of the 2014 Capital One annual report below. You can navigate through the pages in the report by either clicking on the pages listed below, or by using the keyword search tool below to find specific information within the annual report.-
 1
1 -
2
-
3
-
4
-
5
-
6
-
7
-
8
-
9
-
10
-
11
-
12
-
13
-
14
-
15
-
16
-
17
-
18
-
19
-
20
-
21
-
22
-
23
-
24
-
25
-
26
-
27
-
28
-
29
-
30
-
31
-
32
-
33
-
34
-
35
-
36
-
37
-
38
-
39
-
40
-
41
-
42
-
43
-
44
-
45
-
46
-
47
-
48
-
49
-
50
-
51
-
52
-
53
-
54
-
55
-
56
-
57
-
58
-
59
-
60
-
61
-
62
-
63
-
64
-
 65
65 -
 66
66 -
 67
67 -
 68
68 -
 69
69 -
 70
70 -
 71
71 -
 72
72 -
 73
73 -
 74
74 -
 75
75 -
 76
76 -
 77
77 -
 78
78 -
 79
79 -
 80
80 -
 81
81 -
 82
82 -
 83
83 -
 84
84 -
 85
85 -
86
-
87
-
88
-
89
-
90
-
91
-
92
-
93
-
94
-
95
-
96
-
97
-
98
-
99
-
100
-
101
-
102
-
103
-
104
-
105
-
106
-
107
-
108
-
109
-
110
-
111
-
112
-
113
-
114
-
115
-
116
-
117
-
118
-
119
-
120
-
121
-
122
-
123
-
124
-
125
-
126
-
127
-
128
-
129
-
130
-
131
-
132
-
133
-
134
-
135
-
136
-
137
-
138
-
139
-
140
-
141
-
142
-
143
-
144
-
145
-
146
-
147
-
148
-
149
-
150
-
151
-
152
-
153
-
154
-
155
-
156
-
157
-
158
-
159
-
160
-
161
-
162
-
163
-
164
-
165
-
166
-
167
-
168
-
169
-
170
-
171
-
172
-
173
-
174
-
175
-
176
-
177
-
178
-
179
-
180
-
181
-
182
-
183
-
184
-
185
-
186
-
187
-
188
-
189
-
190
-
191
-
192
-
193
-
194
-
195
-
196
-
197
-
198
-
199
-
200
-
201
-
202
-
203
-
204
-
205
-
206
-
207
-
208
-
209
-
210
-
211
-
212
-
213
-
214
-
215
-
216
-
217
-
218
-
219
-
220
-
221
-
222
-
223
-
224
-
225
-
226
-
227
-
228
-
229
-
230
-
231
-
232
-
233
-
234
-
235
-
236
-
237
-
238
-
239
-
240
-
241
-
242
-
243
-
244
-
245
-
246
-
247
-
248
-
249
-
250
-
251
-
252
-
253
-
254
-
255
-
256
-
257
-
258
-
259
-
260
-
261
-
262
-
263
-
264
-
265
-
266
-
267
-
268
-
269
-
270
-
271
-
272
-
273
-
274
-
275
-
276
-
277
-
278
-
279
-
280
-
281
-
282
-
283
-
284
-
285
-
286
-
287
-
288
-
289
-
290
-
291
-
292
-
293
-
294
-
295
-
296
-
297
-
298
-
299
-
300
 |
 |

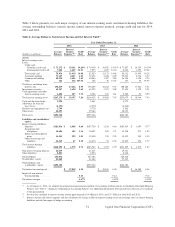
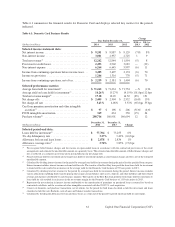
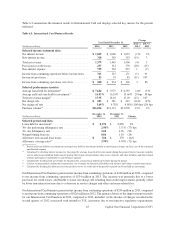
Table 3 displays the change in our net interest income between periods and the extent to which the variance is
attributable to: (i) changes in the volume of our interest-earning assets and interest-bearing liabilities; or (ii) changes
in the interest rates related to these assets and liabilities.
Table 3: Rate/Volume Analysis of Net Interest Income(1)
2014 vs. 2013 2013 vs. 2012
Total Total
(Dollars in millions) Variance Volume Rate Variance Volume Rate
Interest income:
Loans:
Credit card . . . . . . . . . . . . . . . . . . . . . . . . . . . . . . $ (741) $ (576) $(165) $ 726 $ 408 $ 318
Consumer banking . . . . . . . . . . . . . . . . . . . . . . . . 19 (93) 112 (88) 37 (125)
Commercial banking . . . . . . . . . . . . . . . . . . . . . . 62 251 (189) 59 190 (131)
Other . . . . . . . . . . . . . . . . . . . . . . . . . . . . . . . . . . . 100 (9) 109 (19) 4 (23)
Total loans, including loans held for sale . . . . . . . . . (560) (427) (133) 678 639 39
Investment securities . . . . . . . . . . . . . . . . . . . . . . . . 53 (24) 77 246 147 99
Cash equivalents and other interest-earning assets . . 6 (1) 7 10 (35) 45
Total interest income . . . . . . . . . . . . . . . . . . . . . . . . (501) (452) (49) 934 751 183
Interest expense:
Deposits . . . . . . . . . . . . . . . . . . . . . . . . . . . . . . . . (153) (43) (110) (162) 33 (195)
Securitized debt obligations . . . . . . . . . . . . . . . . . (38) — (38) (88) (61) (27)
Senior and subordinated notes . . . . . . . . . . . . . . . (16) 74 (90) (30) 41 (71)
Other borrowings and liabilities . . . . . . . . . . . . . . (6) (8) 2 (303) 44 (347)
Total interest expense . . . . . . . . . . . . . . . . . . . . . . . . (213) 23 (236) (583) 57 (640)
Net interest income . . . . . . . . . . . . . . . . . . . . . . . . . $ (288) $ (475) $ 187 $1,517 $ 694 $ 823
(1) We calculate the change in interest income and interest expense separately for each item. The portion of interest income or interest expense
attributable to both volume and rate is allocated proportionately when the calculation results in a positive value. When the portion of interest
income or interest expense attributable to both volume and rate results in a negative value, the total amount is allocated to volume or rate,
depending on which amount is positive.
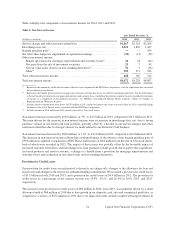
Non-Interest Income
Non-interest income primarily consists of interchange income net of rewards expense, service charges and other
customer-related fees, other non-interest income and, in 2012, the bargain purchase gain attributable to the ING
Direct acquisition in the amount of $594 million. Other non-interest income includes the pre-tax net benefit
(provision) for mortgage representation and warranty losses related to continuing operations. It also includes gains
and losses from the sale of investment securities, gains and losses on derivatives not accounted for in hedge
accounting relationships, and hedge ineffectiveness, which we generally do not allocate to our business segments
because they relate to centralized asset/liability and market risk management activities undertaken by our Corporate
Treasury group.
53 Capital One Financial Corporation (COF)