Capital One 2014 Annual Report Download - page 57
Download and view the complete annual report
Please find page 57 of the 2014 Capital One annual report below. You can navigate through the pages in the report by either clicking on the pages listed below, or by using the keyword search tool below to find specific information within the annual report.-
 1
1 -
2
-
3
-
4
-
5
-
6
-
7
-
8
-
9
-
10
-
11
-
12
-
13
-
14
-
15
-
16
-
17
-
18
-
19
-
20
-
21
-
22
-
23
-
24
-
25
-
26
-
27
-
28
-
29
-
30
-
31
-
32
-
33
-
34
-
35
-
36
-
37
-
38
-
39
-
40
-
41
-
42
-
43
-
44
-
45
-
46
-
 47
47 -
 48
48 -
 49
49 -
 50
50 -
 51
51 -
 52
52 -
 53
53 -
 54
54 -
 55
55 -
 56
56 -
 57
57 -
 58
58 -
 59
59 -
 60
60 -
 61
61 -
 62
62 -
 63
63 -
 64
64 -
 65
65 -
 66
66 -
 67
67 -
68
-
69
-
70
-
71
-
72
-
73
-
74
-
75
-
76
-
77
-
78
-
79
-
80
-
81
-
82
-
83
-
84
-
85
-
86
-
87
-
88
-
89
-
90
-
91
-
92
-
93
-
94
-
95
-
96
-
97
-
98
-
99
-
100
-
101
-
102
-
103
-
104
-
105
-
106
-
107
-
108
-
109
-
110
-
111
-
112
-
113
-
114
-
115
-
116
-
117
-
118
-
119
-
120
-
121
-
122
-
123
-
124
-
125
-
126
-
127
-
128
-
129
-
130
-
131
-
132
-
133
-
134
-
135
-
136
-
137
-
138
-
139
-
140
-
141
-
142
-
143
-
144
-
145
-
146
-
147
-
148
-
149
-
150
-
151
-
152
-
153
-
154
-
155
-
156
-
157
-
158
-
159
-
160
-
161
-
162
-
163
-
164
-
165
-
166
-
167
-
168
-
169
-
170
-
171
-
172
-
173
-
174
-
175
-
176
-
177
-
178
-
179
-
180
-
181
-
182
-
183
-
184
-
185
-
186
-
187
-
188
-
189
-
190
-
191
-
192
-
193
-
194
-
195
-
196
-
197
-
198
-
199
-
200
-
201
-
202
-
203
-
204
-
205
-
206
-
207
-
208
-
209
-
210
-
211
-
212
-
213
-
214
-
215
-
216
-
217
-
218
-
219
-
220
-
221
-
222
-
223
-
224
-
225
-
226
-
227
-
228
-
229
-
230
-
231
-
232
-
233
-
234
-
235
-
236
-
237
-
238
-
239
-
240
-
241
-
242
-
243
-
244
-
245
-
246
-
247
-
248
-
249
-
250
-
251
-
252
-
253
-
254
-
255
-
256
-
257
-
258
-
259
-
260
-
261
-
262
-
263
-
264
-
265
-
266
-
267
-
268
-
269
-
270
-
271
-
272
-
273
-
274
-
275
-
276
-
277
-
278
-
279
-
280
-
281
-
282
-
283
-
284
-
285
-
286
-
287
-
288
-
289
-
290
-
291
-
292
-
293
-
294
-
295
-
296
-
297
-
298
-
299
-
300
 |
 |

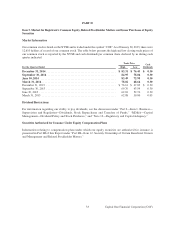
Issuer Purchases of Equity Securities
The following table presents information related to repurchases of shares of our common stock for each calendar
month in the fourth quarter of 2014.
Total Number of Maximum
Total Shares Purchased as Amount That May
Number Average Part of Publicly Yet be Purchased
of Shares Price Paid Announced Under the Plan
(Dollars in millions, except per share information) Purchased(1) per Share(2) Plans or Program(2)
October . . . . . . . . . . . . . . . . . . . . . . . . . . . . . . . . . . 2,648,911 $ 80.08 2,634,300 $ 789
November . . . . . . . . . . . . . . . . . . . . . . . . . . . . . . . . 2,123,473 81.85 2,116,925 616
December . . . . . . . . . . . . . . . . . . . . . . . . . . . . . . . . 1,403,015 82.56 1,402,575 500
Total . . . . . . . . . . . . . . . . . . . . . . . . . . . . . . . . . . . . 6,175,399 $ 81.25 6,153,800
(1) Primarily comprised of repurchases under the $2.5 billion common stock repurchase program authorized by our Board of Directors and
announced on March 26, 2014, which authorized share repurchases through March 31, 2015. Also includes 14,611 shares, 6,548 shares and
440 shares purchased in October, November and December, respectively, related to the withholding of shares to cover taxes on restricted
stock awards whose restrictions have lapsed.
(2) Amounts exclude commission costs.
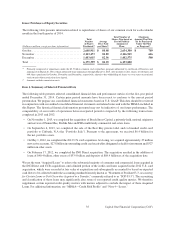
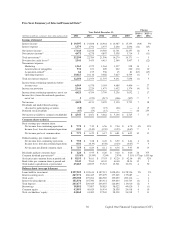
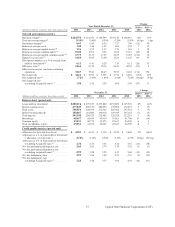
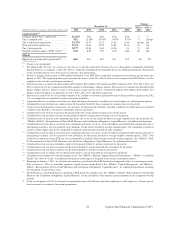
Item 6. Summary of Selected Financial Data
The following table presents selected consolidated financial data and performance metrics for the five-year period
ended December 31, 2014. Certain prior period amounts have been recast to conform to the current period
presentation. We prepare our consolidated financial statements based on U.S. GAAP. This data should be reviewed
in conjunction with our audited consolidated financial statements and related notes and with the MD&A included in
this Report. The historical financial information presented may not be indicative of our future performance. The
comparability of our results of operations between reported periods is impacted by the following transactions
completed in 2013 and 2012:
• On November 1, 2013, we completed the acquisition of Beech Street Capital, a privately-held, national originator
and servicer of Fannie Mae, Freddie Mac and FHA multifamily commercial real estate loans.
• On September 6, 2013, we completed the sale of the Best Buy private label and co-branded credit card
portfolio to Citibank, N.A (the “Portfolio Sale”). Pursuant to the agreement, we received $6.4 billion for
the net portfolio assets.
• On May 1, 2012, we completed the 2012 U.S. card acquisition. At closing, we acquired approximately 27 million
new active accounts, $27.8 billion in outstanding credit card receivables designated as held for investment and $327
million in other assets.
• On February 17, 2012, we completed the ING Direct acquisition. The acquisition resulted in the addition of
loans of $40.4 billion, other assets of $53.9 billion and deposits of $84.4 billion as of the acquisition date.
We use the term “Acquired Loans” to refer to the substantial majority of consumer and commercial loans acquired in
the ING Direct and CCB acquisitions, and a limited portion of the credit card loans acquired in the 2012 U.S. card
acquisition, which were recorded at fair value at acquisition and subsequently accounted for based on expected
cash flows to be collected (under the accounting standard formerly known as “Statement of Position 03-3, Accounting
for Certain Loans or Debt Securities Acquired in a Transfer,” commonly referred to as “SOP 03-3”). The accounting
and classification of these loans may significantly alter some of our reported credit quality metrics. We therefore
supplement certain reported credit quality metrics with metrics adjusted to exclude the impact of these Acquired
Loans. For additional information, see “MD&A—Credit Risk Profile” and “Note 4—Loans.”
35 Capital One Financial Corporation (COF)