Capital One 2014 Annual Report Download - page 117
Download and view the complete annual report
Please find page 117 of the 2014 Capital One annual report below. You can navigate through the pages in the report by either clicking on the pages listed below, or by using the keyword search tool below to find specific information within the annual report.-
 1
1 -
2
-
3
-
4
-
5
-
6
-
7
-
8
-
9
-
10
-
11
-
12
-
13
-
14
-
15
-
16
-
17
-
18
-
19
-
20
-
21
-
22
-
23
-
24
-
25
-
26
-
27
-
28
-
29
-
30
-
31
-
32
-
33
-
34
-
35
-
36
-
37
-
38
-
39
-
40
-
41
-
42
-
43
-
44
-
45
-
46
-
47
-
48
-
49
-
50
-
51
-
52
-
53
-
54
-
55
-
56
-
57
-
58
-
59
-
60
-
61
-
62
-
63
-
64
-
65
-
66
-
67
-
68
-
69
-
70
-
71
-
72
-
73
-
74
-
75
-
76
-
77
-
78
-
79
-
80
-
81
-
82
-
83
-
84
-
85
-
86
-
87
-
88
-
89
-
90
-
91
-
92
-
93
-
94
-
95
-
96
-
97
-
98
-
99
-
100
-
101
-
102
-
103
-
104
-
105
-
106
-
 107
107 -
 108
108 -
 109
109 -
 110
110 -
 111
111 -
 112
112 -
 113
113 -
 114
114 -
 115
115 -
 116
116 -
 117
117 -
 118
118 -
 119
119 -
 120
120 -
 121
121 -
 122
122 -
 123
123 -
 124
124 -
 125
125 -
 126
126 -
 127
127 -
128
-
129
-
130
-
131
-
132
-
133
-
134
-
135
-
136
-
137
-
138
-
139
-
140
-
141
-
142
-
143
-
144
-
145
-
146
-
147
-
148
-
149
-
150
-
151
-
152
-
153
-
154
-
155
-
156
-
157
-
158
-
159
-
160
-
161
-
162
-
163
-
164
-
165
-
166
-
167
-
168
-
169
-
170
-
171
-
172
-
173
-
174
-
175
-
176
-
177
-
178
-
179
-
180
-
181
-
182
-
183
-
184
-
185
-
186
-
187
-
188
-
189
-
190
-
191
-
192
-
193
-
194
-
195
-
196
-
197
-
198
-
199
-
200
-
201
-
202
-
203
-
204
-
205
-
206
-
207
-
208
-
209
-
210
-
211
-
212
-
213
-
214
-
215
-
216
-
217
-
218
-
219
-
220
-
221
-
222
-
223
-
224
-
225
-
226
-
227
-
228
-
229
-
230
-
231
-
232
-
233
-
234
-
235
-
236
-
237
-
238
-
239
-
240
-
241
-
242
-
243
-
244
-
245
-
246
-
247
-
248
-
249
-
250
-
251
-
252
-
253
-
254
-
255
-
256
-
257
-
258
-
259
-
260
-
261
-
262
-
263
-
264
-
265
-
266
-
267
-
268
-
269
-
270
-
271
-
272
-
273
-
274
-
275
-
276
-
277
-
278
-
279
-
280
-
281
-
282
-
283
-
284
-
285
-
286
-
287
-
288
-
289
-
290
-
291
-
292
-
293
-
294
-
295
-
296
-
297
-
298
-
299
-
300
 |
 |

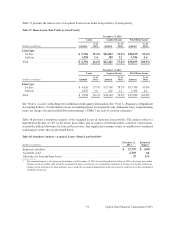
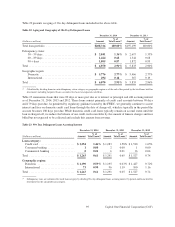
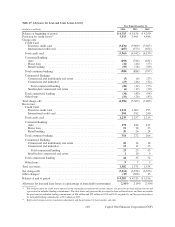
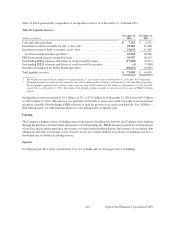
Table 22 presents an aging of 30+ day delinquent loans included in the above table.
Table 22: Aging and Geography of 30+ Day Delinquent Loans
December 31, 2014 December 31, 2013
% of % of
(Dollars in millions) Amount Total Loans(1) Amount Total Loans(1)
Total loan portfolio . . . . . . . . . . . . . . . . . . . . . . . . . . . . . . . . $208,316 100.00% $197,199 100.00%
Delinquency status:
30 – 59 days . . . . . . . . . . . . . . . . . . . . . . . . . . . . . . . . . . $ 2,841 1.36% $ 2,617 1.33%
60 – 89 days . . . . . . . . . . . . . . . . . . . . . . . . . . . . . . . . . . 1,424 0.68 1,344 0.68
90 + days . . . . . . . . . . . . . . . . . . . . . . . . . . . . . . . . . . . . 1,805 0.87 1,872 0.95
Total . . . . . . . . . . . . . . . . . . . . . . . . . . . . . . . . . . . . . . . . . . . . $ 6,070 2.91% $ 5,833 2.96%
Geographic region:
Domestic . . . . . . . . . . . . . . . . . . . . . . . . . . . . . . . . . . . . $ 5,776 2.77% $ 5,466 2.77%
International . . . . . . . . . . . . . . . . . . . . . . . . . . . . . . . . . . 294 0.14 367 0.19
Total . . . . . . . . . . . . . . . . . . . . . . . . . . . . . . . . . . . . . . . . . . . . $ 6,070 2.91% $ 5,833 2.96%
(1) Calculated by dividing loans in each delinquency status category or geographic region as of the end of the period by the total loans held for
investment, including Acquired Loans accounted for based on expected cash flows.
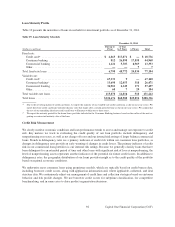
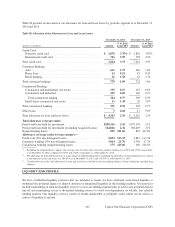
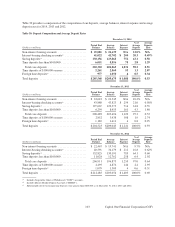
Table 23 summarizes loans that were 90 days or more past due as to interest or principal and still accruing interest
as of December 31, 2014, 2013 and 2012. These loans consist primarily of credit card accounts between 90 days
and 179 days past due. As permitted by regulatory guidance issued by the FFIEC, we generally continue to accrue
interest and fees on domestic credit card loans through the date of charge-off, which is typically in the period the
account becomes 180 days past due. While domestic credit card loans typically remain on accrual status until the
loan is charged-off, we reduce the balance of our credit card receivables by the amount of finance charges and fees
billed but not expected to be collected and exclude this amount from revenue.
Table 23: 90+ Day Delinquent Loans Accruing Interest
December 31, 2014 December 31, 2013 December 31, 2012
% of % of % of
(Dollars in millions) Amount Total Loans(1) Amount Total Loans(1) Amount Total Loans(1)
Loan category:
Credit card . . . . . . . . . . . . . . . . . . . . . . . . . $ 1,254 1.46% $ 1,283 1.58% $ 1,510 1.65%
Consumer banking . . . . . . . . . . . . . . . . . . . 1 0.00 2 0.00 1 0.00
Commercial banking . . . . . . . . . . . . . . . . . 8 0.01 6 0.01 16 0.04
Total . . . . . . . . . . . . . . . . . . . . . . . . . . . . . . . . $ 1,263 0.61 $ 1,291 0.65 $ 1,527 0.74
Geographic region:
Domestic . . . . . . . . . . . . . . . . . . . . . . . . . . $ 1,190 0.59% $ 1,195 0.63% $ 1,427 0.72%
International . . . . . . . . . . . . . . . . . . . . . . . . 73 0.90 96 1.19 100 1.16
Total . . . . . . . . . . . . . . . . . . . . . . . . . . . . . . . . $ 1,263 0.61 $ 1,291 0.65 $ 1,527 0.74
(1) Delinquency rates are calculated for each loan category by dividing 90+ day delinquent loans accruing interest by period-end loans held for
investment for the specified loan category.
95 Capital One Financial Corporation (COF)