Capital One 2014 Annual Report Download - page 114
Download and view the complete annual report
Please find page 114 of the 2014 Capital One annual report below. You can navigate through the pages in the report by either clicking on the pages listed below, or by using the keyword search tool below to find specific information within the annual report.-
 1
1 -
2
-
3
-
4
-
5
-
6
-
7
-
8
-
9
-
10
-
11
-
12
-
13
-
14
-
15
-
16
-
17
-
18
-
19
-
20
-
21
-
22
-
23
-
24
-
25
-
26
-
27
-
28
-
29
-
30
-
31
-
32
-
33
-
34
-
35
-
36
-
37
-
38
-
39
-
40
-
41
-
42
-
43
-
44
-
45
-
46
-
47
-
48
-
49
-
50
-
51
-
52
-
53
-
54
-
55
-
56
-
57
-
58
-
59
-
60
-
61
-
62
-
63
-
64
-
65
-
66
-
67
-
68
-
69
-
70
-
71
-
72
-
73
-
74
-
75
-
76
-
77
-
78
-
79
-
80
-
81
-
82
-
83
-
84
-
85
-
86
-
87
-
88
-
89
-
90
-
91
-
92
-
93
-
94
-
95
-
96
-
97
-
98
-
99
-
100
-
101
-
102
-
103
-
 104
104 -
 105
105 -
 106
106 -
 107
107 -
 108
108 -
 109
109 -
 110
110 -
 111
111 -
 112
112 -
 113
113 -
 114
114 -
 115
115 -
 116
116 -
 117
117 -
 118
118 -
 119
119 -
 120
120 -
 121
121 -
 122
122 -
 123
123 -
 124
124 -
125
-
126
-
127
-
128
-
129
-
130
-
131
-
132
-
133
-
134
-
135
-
136
-
137
-
138
-
139
-
140
-
141
-
142
-
143
-
144
-
145
-
146
-
147
-
148
-
149
-
150
-
151
-
152
-
153
-
154
-
155
-
156
-
157
-
158
-
159
-
160
-
161
-
162
-
163
-
164
-
165
-
166
-
167
-
168
-
169
-
170
-
171
-
172
-
173
-
174
-
175
-
176
-
177
-
178
-
179
-
180
-
181
-
182
-
183
-
184
-
185
-
186
-
187
-
188
-
189
-
190
-
191
-
192
-
193
-
194
-
195
-
196
-
197
-
198
-
199
-
200
-
201
-
202
-
203
-
204
-
205
-
206
-
207
-
208
-
209
-
210
-
211
-
212
-
213
-
214
-
215
-
216
-
217
-
218
-
219
-
220
-
221
-
222
-
223
-
224
-
225
-
226
-
227
-
228
-
229
-
230
-
231
-
232
-
233
-
234
-
235
-
236
-
237
-
238
-
239
-
240
-
241
-
242
-
243
-
244
-
245
-
246
-
247
-
248
-
249
-
250
-
251
-
252
-
253
-
254
-
255
-
256
-
257
-
258
-
259
-
260
-
261
-
262
-
263
-
264
-
265
-
266
-
267
-
268
-
269
-
270
-
271
-
272
-
273
-
274
-
275
-
276
-
277
-
278
-
279
-
280
-
281
-
282
-
283
-
284
-
285
-
286
-
287
-
288
-
289
-
290
-
291
-
292
-
293
-
294
-
295
-
296
-
297
-
298
-
299
-
300
 |
 |

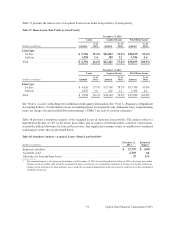
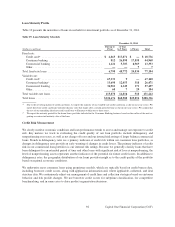
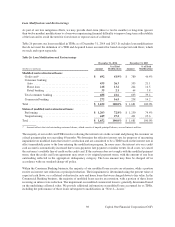
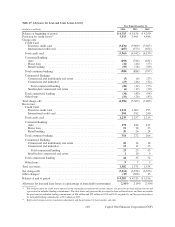
Loan Maturity Profile
Table 19 presents the maturities of loans in our held-for-investment portfolio as of December 31, 2014.
Table 19: Loan Maturity Schedule
December 31, 2014
Due up to >1 Year
(Dollars in millions) 1 Year to 5 Years >5 Years Total
Fixed rate:
Credit card(1) . . . . . . . . . . . . . . . . . . . . . . . . . . . . . . . . . . . . . . . . . . $ 4,865 $13,871 $ — $ 18,736
Consumer banking . . . . . . . . . . . . . . . . . . . . . . . . . . . . . . . . . . . . . 812 26,598 17,558 44,968
Commercial banking . . . . . . . . . . . . . . . . . . . . . . . . . . . . . . . . . . . 1,121 5,303 6,969 13,393
Other . . . . . . . . . . . . . . . . . . . . . . . . . . . . . . . . . . . . . . . . . . . . . . . . —— 7 7
Total fixed-rate loans . . . . . . . . . . . . . . . . . . . . . . . . . . . . . . . . . . . . . . 6,798 45,772 24,534 77,104
Variable rate:
Credit card(1) . . . . . . . . . . . . . . . . . . . . . . . . . . . . . . . . . . . . . . . . . . 67,131 9 — 67,140
Consumer banking(2) . . . . . . . . . . . . . . . . . . . . . . . . . . . . . . . . . . . . 13,698 12,455 318 26,471
Commercial banking . . . . . . . . . . . . . . . . . . . . . . . . . . . . . . . . . . . 34,981 2,345 171 37,497
Other . . . . . . . . . . . . . . . . . . . . . . . . . . . . . . . . . . . . . . . . . . . . . . . . 68 7 29 104
Total variable-rate loans . . . . . . . . . . . . . . . . . . . . . . . . . . . . . . . . . . . . 115,878 14,816 518 131,212
Total loans . . . . . . . . . . . . . . . . . . . . . . . . . . . . . . . . . . . . . . . . . . . . . . $122,676 $60,588 $25,052 $208,316
(1) Due to the revolving nature of credit card loans, we report the majority of our variable-rate credit card loans as due in one year or less. We
report fixed-rate credit card loans with introductory rates that expire after a certain period of time as due in one year or less. We assume that
the rest of our remaining fixed-rate credit card loans will mature within one to three years.
(2) We report the maturity period for the home loans portfolio included in the Consumer Banking business based on the earlier of the next re-
pricing or contractual maturity date of the loan.
Credit Risk Measurement
We closely monitor economic conditions and loan performance trends to assess and manage our exposure to credit
risk. Key metrics we track in evaluating the credit quality of our loan portfolio include delinquency and
nonperforming asset rates, as well as net charge-off rates and our internal risk ratings of larger balance commercial
loans. Trends in delinquency rates are a primary indicator of credit risk within our consumer loan portfolios, as
changes in delinquency rates provide an early warning of changes in credit losses. The primary indicator of credit
risk in our commercial loan portfolios is our internal risk ratings. Because we generally classify loans that have
been delinquent for an extended period of time and other loans with significant risk of loss as nonperforming, the
level of nonperforming assets represents another indicator of the potential for future credit losses. In addition to
delinquency rates, the geographic distribution of our loans provides insight as to the credit quality of the portfolio
based on regional economic conditions.
We underwrite most consumer loans using proprietary models, which are typically based on credit bureau data,
including borrower credit scores, along with application information and, where applicable, collateral, and deal
structure data. We continuously adjust our management of credit lines and collection strategies based on customer
behavior and risk profile changes. We use borrower credit scores for subprime classification, for competitive
benchmarking, and in some cases to drive product segmentation decisions.
92 Capital One Financial Corporation (COF)