Capital One 2014 Annual Report Download - page 74
Download and view the complete annual report
Please find page 74 of the 2014 Capital One annual report below. You can navigate through the pages in the report by either clicking on the pages listed below, or by using the keyword search tool below to find specific information within the annual report.-
 1
1 -
2
-
3
-
4
-
5
-
6
-
7
-
8
-
9
-
10
-
11
-
12
-
13
-
14
-
15
-
16
-
17
-
18
-
19
-
20
-
21
-
22
-
23
-
24
-
25
-
26
-
27
-
28
-
29
-
30
-
31
-
32
-
33
-
34
-
35
-
36
-
37
-
38
-
39
-
40
-
41
-
42
-
43
-
44
-
45
-
46
-
47
-
48
-
49
-
50
-
51
-
52
-
53
-
54
-
55
-
56
-
57
-
58
-
59
-
60
-
61
-
62
-
63
-
 64
64 -
 65
65 -
 66
66 -
 67
67 -
 68
68 -
 69
69 -
 70
70 -
 71
71 -
 72
72 -
 73
73 -
 74
74 -
 75
75 -
 76
76 -
 77
77 -
 78
78 -
 79
79 -
 80
80 -
 81
81 -
 82
82 -
 83
83 -
 84
84 -
85
-
86
-
87
-
88
-
89
-
90
-
91
-
92
-
93
-
94
-
95
-
96
-
97
-
98
-
99
-
100
-
101
-
102
-
103
-
104
-
105
-
106
-
107
-
108
-
109
-
110
-
111
-
112
-
113
-
114
-
115
-
116
-
117
-
118
-
119
-
120
-
121
-
122
-
123
-
124
-
125
-
126
-
127
-
128
-
129
-
130
-
131
-
132
-
133
-
134
-
135
-
136
-
137
-
138
-
139
-
140
-
141
-
142
-
143
-
144
-
145
-
146
-
147
-
148
-
149
-
150
-
151
-
152
-
153
-
154
-
155
-
156
-
157
-
158
-
159
-
160
-
161
-
162
-
163
-
164
-
165
-
166
-
167
-
168
-
169
-
170
-
171
-
172
-
173
-
174
-
175
-
176
-
177
-
178
-
179
-
180
-
181
-
182
-
183
-
184
-
185
-
186
-
187
-
188
-
189
-
190
-
191
-
192
-
193
-
194
-
195
-
196
-
197
-
198
-
199
-
200
-
201
-
202
-
203
-
204
-
205
-
206
-
207
-
208
-
209
-
210
-
211
-
212
-
213
-
214
-
215
-
216
-
217
-
218
-
219
-
220
-
221
-
222
-
223
-
224
-
225
-
226
-
227
-
228
-
229
-
230
-
231
-
232
-
233
-
234
-
235
-
236
-
237
-
238
-
239
-
240
-
241
-
242
-
243
-
244
-
245
-
246
-
247
-
248
-
249
-
250
-
251
-
252
-
253
-
254
-
255
-
256
-
257
-
258
-
259
-
260
-
261
-
262
-
263
-
264
-
265
-
266
-
267
-
268
-
269
-
270
-
271
-
272
-
273
-
274
-
275
-
276
-
277
-
278
-
279
-
280
-
281
-
282
-
283
-
284
-
285
-
286
-
287
-
288
-
289
-
290
-
291
-
292
-
293
-
294
-
295
-
296
-
297
-
298
-
299
-
300
 |
 |
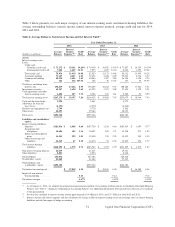
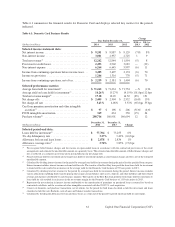
Net interest income decreased by $288 million, or 2%, to $17.8 billion in 2014, compared to $18.1 billion in 2013.
These decreases were primarily driven by the Portfolio Sale in 2013, partially offset by growth in commercial, auto
and credit card loan portfolios, lower funding costs and higher yielding investment securities in 2014.
•Average Interest-Earning Assets: The increase in average interest-earning assets in 2014, compared to 2013,
was due to continued strong growth in commercial, auto and credit card loans (excluding the impact from the
Portfolio sale in 2013), partially offset by the run-off of our acquired home loan portfolio within our Consumer
Banking business. The decrease in average investment securities was due to sales and paydowns outpacing
purchases.
•Net Interest Margin: The decrease in our net interest margin in 2014, compared to 2013, was primarily due to
lower average loan yields driven by the Portfolio Sale in 2013 and a shift in the mix of the loan portfolio to
lower yielding commercial and auto loans, partially offset by a reduction in our cost of funds and higher yielding
investment securities.
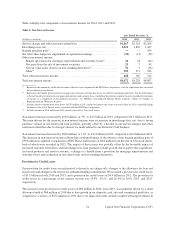
Net interest income increased by $1.5 billion, or 9%, to $18.1 billion in 2013, compared to $16.6 billion in 2012.
The increases were primarily driven by higher average interest-earning assets, lower funding costs and higher
yielding investment securities in 2013.
•Average Interest-Earning Assets: The increase in average interest-earning assets in 2013, compared to 2012,
reflects the full year impact of loans and investment securities from the ING Direct acquisition and the addition
of loans from the 2012 U.S. card acquisition. Growth in average interest-earning assets was also driven by
continued strong growth in commercial and auto loans, which was partially offset by the run-off of our acquired
home loan portfolio in our Consumer Banking business, the expected run-off of higher-margin, higher-loss
receivables acquired in the 2012 U.S. card acquisition and installment loans in our Credit Card business, as
well as the Portfolio Sale in the third quarter of 2013.
•Net Interest Margin: The increase in our net interest margin in 2013, compared to 2012, was primarily
attributable to a reduction in our cost of funds, which was due in part to the redemption of $3.65 billion of our
trust preferred securities on January 2, 2013, which generally carried a higher coupon than other funding sources
available to us. Our lowered cost of funds also reflects the continued benefit from the shift in the mix of our
funding to lower cost consumer and commercial banking deposits from higher cost wholesale sources and a
decline in deposit interest rates as a result of the continued overall low interest rate environment.
52 Capital One Financial Corporation (COF)