Capital One 2014 Annual Report Download - page 88
Download and view the complete annual report
Please find page 88 of the 2014 Capital One annual report below. You can navigate through the pages in the report by either clicking on the pages listed below, or by using the keyword search tool below to find specific information within the annual report.-
 1
1 -
2
-
3
-
4
-
5
-
6
-
7
-
8
-
9
-
10
-
11
-
12
-
13
-
14
-
15
-
16
-
17
-
18
-
19
-
20
-
21
-
22
-
23
-
24
-
25
-
26
-
27
-
28
-
29
-
30
-
31
-
32
-
33
-
34
-
35
-
36
-
37
-
38
-
39
-
40
-
41
-
42
-
43
-
44
-
45
-
46
-
47
-
48
-
49
-
50
-
51
-
52
-
53
-
54
-
55
-
56
-
57
-
58
-
59
-
60
-
61
-
62
-
63
-
64
-
65
-
66
-
67
-
68
-
69
-
70
-
71
-
72
-
73
-
74
-
75
-
76
-
77
-
 78
78 -
 79
79 -
 80
80 -
 81
81 -
 82
82 -
 83
83 -
 84
84 -
 85
85 -
 86
86 -
 87
87 -
 88
88 -
 89
89 -
 90
90 -
 91
91 -
 92
92 -
 93
93 -
 94
94 -
 95
95 -
 96
96 -
 97
97 -
 98
98 -
99
-
100
-
101
-
102
-
103
-
104
-
105
-
106
-
107
-
108
-
109
-
110
-
111
-
112
-
113
-
114
-
115
-
116
-
117
-
118
-
119
-
120
-
121
-
122
-
123
-
124
-
125
-
126
-
127
-
128
-
129
-
130
-
131
-
132
-
133
-
134
-
135
-
136
-
137
-
138
-
139
-
140
-
141
-
142
-
143
-
144
-
145
-
146
-
147
-
148
-
149
-
150
-
151
-
152
-
153
-
154
-
155
-
156
-
157
-
158
-
159
-
160
-
161
-
162
-
163
-
164
-
165
-
166
-
167
-
168
-
169
-
170
-
171
-
172
-
173
-
174
-
175
-
176
-
177
-
178
-
179
-
180
-
181
-
182
-
183
-
184
-
185
-
186
-
187
-
188
-
189
-
190
-
191
-
192
-
193
-
194
-
195
-
196
-
197
-
198
-
199
-
200
-
201
-
202
-
203
-
204
-
205
-
206
-
207
-
208
-
209
-
210
-
211
-
212
-
213
-
214
-
215
-
216
-
217
-
218
-
219
-
220
-
221
-
222
-
223
-
224
-
225
-
226
-
227
-
228
-
229
-
230
-
231
-
232
-
233
-
234
-
235
-
236
-
237
-
238
-
239
-
240
-
241
-
242
-
243
-
244
-
245
-
246
-
247
-
248
-
249
-
250
-
251
-
252
-
253
-
254
-
255
-
256
-
257
-
258
-
259
-
260
-
261
-
262
-
263
-
264
-
265
-
266
-
267
-
268
-
269
-
270
-
271
-
272
-
273
-
274
-
275
-
276
-
277
-
278
-
279
-
280
-
281
-
282
-
283
-
284
-
285
-
286
-
287
-
288
-
289
-
290
-
291
-
292
-
293
-
294
-
295
-
296
-
297
-
298
-
299
-
300
 |
 |
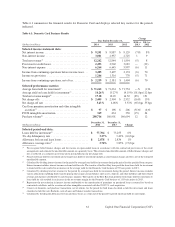
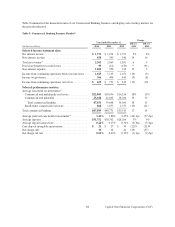
•Non-Interest Income: Non-interest income decreased by $65 million, or 9%, to $684 million in 2014, compared
to $749 million in 2013. The decrease in non-interest income in 2014 was primarily attributable to the sale of
certain MSRs in 2013.
•Provision for Credit Losses: The provision for credit losses increased by $47 million, or 7%, to $703 million
in 2014, compared to $656 million in 2013. The increase in 2014, as compared to 2013, was driven by higher
net charge-offs due to the growth in our auto loan portfolio and a smaller release of the allowance for loan and
lease losses in the retail banking and home loan portfolios, offset by a smaller allowance build in the auto loan
portfolio.
•Non-Interest Expense: Non-interest expense increased by $124 million, or 3%, to $3.9 billion in 2014, compared
to $3.7 billion in 2013. The increase was largely due to the growth in our auto loan portfolio and to a smaller
degree, the change to include the auto repossession-related expenses as a component of operating expenses.
Prior to January 1, 2014, these costs were reported as a component of net charge-offs.
•Loans Held for Investment: Period-end loans held for investment increased by $677 million, or 1%, to $71.4
billion as of December 31, 2014, from $70.8 billion as of December 31, 2013, primarily due to the growth in
the auto loan portfolio, mostly offset by the run-off of our acquired home loan portfolio. Average loans held for
investment decreased by $1.5 billion, or 2%, to $71.0 billion in 2014, compared to $72.5 billion in 2013 due to
the run-off in our acquired home loan portfolio outpacing growth in our auto loan portfolio.
•Deposits: Period-end deposits increased by $426 million, or less than 1%, to $168.1 billion as of December 31,
2014, from $167.7 billion as of December 31, 2013.
•Net Charge-off and Delinquency Statistics: The net charge-off rate increased 10 basis points to 0.95% in 2014,
compared to 0.85% in 2013. The increase in the net charge-off rate reflected a shift in the mix of the portfolio
toward auto loans (which typically carry higher net charge-off rates than our home loan portfolio), as the home
loan portfolio runs off. The 30+ day delinquency rate increased to 4.23% as of December 31, 2014, from 3.89%
as of December 31, 2013.
Key factors affecting the results of our Consumer Banking business for 2013, compared to 2012, and changes in
financial condition and credit performance between December 31, 2013 and December 31, 2012 include the
following:
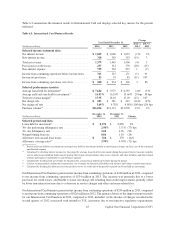
•Net Interest Income: Net interest income increased by $117 million, or 2%, to $5.9 billion in 2013, compared
to $5.8 billion in 2012. The increase in net interest income is primarily attributable to growth in our auto loans
portfolio, partially offset by lower auto and deposits margins. While average loan balances grew in 2013 as
compared to 2012, we saw a decline in gross interest income due to overall lower average yields on loans. The
decrease in auto yields was primarily attributable to a shift in the credit quality mix of our portfolio, as well as
increased competition in the marketplace. The average yield on auto loans was 9.8% in 2013, as compared to
11.0% in 2012. The decrease in home loans was largely driven by the run-off of the acquired home loans
portfolio. The average yield on home loans was 3.4% in 2013 compared to 3.6% in 2012. Average deposit
balances increased to $169.7 billion in 2013, from $162.6 billion in 2012, while the average deposit interest
rate declined to 0.63% in 2013, from 0.70% in 2012.
•Non-Interest Income: Non-interest income decreased by $33 million, or 4%, to $749 million in 2013, compared
to $782 million in 2012, related to the mark-to-market gains on retained interests in interest-only strips and
negative amortization mortgage securities recognized in the third quarter of 2012.
•Provision for Credit Losses: The provision for credit losses increased by $67 million, or 11%, to $656 million
in 2013, reflecting higher auto loan charge-offs attributable to auto portfolio growth and an increase in the auto
charge-off rate from historically low levels.
•Non-Interest Expense: Non-interest expense decreased by $126 million, or 3%, to $3.7 billion in 2013. The
decrease was largely due to the absence of ING Direct acquisition-related costs and other one-time items incurred
in 2012, which were partially offset by increased expenses related to the growth in our auto loan portfolio.
66 Capital One Financial Corporation (COF)