Capital One 2014 Annual Report Download - page 92
Download and view the complete annual report
Please find page 92 of the 2014 Capital One annual report below. You can navigate through the pages in the report by either clicking on the pages listed below, or by using the keyword search tool below to find specific information within the annual report.-
 1
1 -
2
-
3
-
4
-
5
-
6
-
7
-
8
-
9
-
10
-
11
-
12
-
13
-
14
-
15
-
16
-
17
-
18
-
19
-
20
-
21
-
22
-
23
-
24
-
25
-
26
-
27
-
28
-
29
-
30
-
31
-
32
-
33
-
34
-
35
-
36
-
37
-
38
-
39
-
40
-
41
-
42
-
43
-
44
-
45
-
46
-
47
-
48
-
49
-
50
-
51
-
52
-
53
-
54
-
55
-
56
-
57
-
58
-
59
-
60
-
61
-
62
-
63
-
64
-
65
-
66
-
67
-
68
-
69
-
70
-
71
-
72
-
73
-
74
-
75
-
76
-
77
-
78
-
79
-
80
-
81
-
 82
82 -
 83
83 -
 84
84 -
 85
85 -
 86
86 -
 87
87 -
 88
88 -
 89
89 -
 90
90 -
 91
91 -
 92
92 -
 93
93 -
 94
94 -
 95
95 -
 96
96 -
 97
97 -
 98
98 -
 99
99 -
 100
100 -
 101
101 -
 102
102 -
103
-
104
-
105
-
106
-
107
-
108
-
109
-
110
-
111
-
112
-
113
-
114
-
115
-
116
-
117
-
118
-
119
-
120
-
121
-
122
-
123
-
124
-
125
-
126
-
127
-
128
-
129
-
130
-
131
-
132
-
133
-
134
-
135
-
136
-
137
-
138
-
139
-
140
-
141
-
142
-
143
-
144
-
145
-
146
-
147
-
148
-
149
-
150
-
151
-
152
-
153
-
154
-
155
-
156
-
157
-
158
-
159
-
160
-
161
-
162
-
163
-
164
-
165
-
166
-
167
-
168
-
169
-
170
-
171
-
172
-
173
-
174
-
175
-
176
-
177
-
178
-
179
-
180
-
181
-
182
-
183
-
184
-
185
-
186
-
187
-
188
-
189
-
190
-
191
-
192
-
193
-
194
-
195
-
196
-
197
-
198
-
199
-
200
-
201
-
202
-
203
-
204
-
205
-
206
-
207
-
208
-
209
-
210
-
211
-
212
-
213
-
214
-
215
-
216
-
217
-
218
-
219
-
220
-
221
-
222
-
223
-
224
-
225
-
226
-
227
-
228
-
229
-
230
-
231
-
232
-
233
-
234
-
235
-
236
-
237
-
238
-
239
-
240
-
241
-
242
-
243
-
244
-
245
-
246
-
247
-
248
-
249
-
250
-
251
-
252
-
253
-
254
-
255
-
256
-
257
-
258
-
259
-
260
-
261
-
262
-
263
-
264
-
265
-
266
-
267
-
268
-
269
-
270
-
271
-
272
-
273
-
274
-
275
-
276
-
277
-
278
-
279
-
280
-
281
-
282
-
283
-
284
-
285
-
286
-
287
-
288
-
289
-
290
-
291
-
292
-
293
-
294
-
295
-
296
-
297
-
298
-
299
-
300
 |
 |
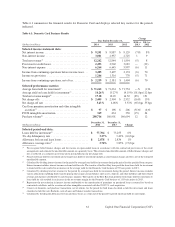
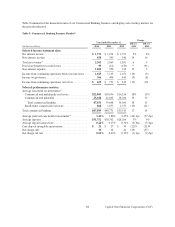
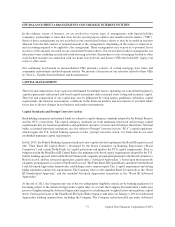
•Loans Held for Investment: Period-end loans held for investment increased by $5.9 billion, or 13%, to $50.9
billion as of December 31, 2014, from $45.0 billion as of December 31, 2013, and average loans held for
investment increased by $7.1 billion, or 17%, to $47.9 billion in 2014, compared to $40.8 billion in 2013. The
increases were driven by loan growth in the commercial and industrial and commercial and multifamily real
estate businesses.
•Deposits: Period-end deposits increased by $1.4 billion, or 5%, to $32.0 billion as of December 31, 2014, from
$30.6 billion as of December 31, 2013, driven by our strategy to deepen and expand relationships with
commercial customers.
•Net Charge-off Statistics: The net charge-off rate decreased to 0.02% in 2014, from 0.03% in 2013. The
nonperforming loans rate increased to 0.34% as of December 31, 2014, from 0.33% as of December 31,
2013. The continued strength in the credit metrics in our Commercial Banking business reflects stable credit
trends.
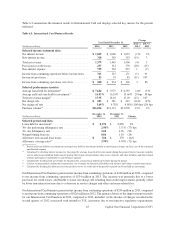
Key factors affecting the results of our Commercial Banking business for 2013, compared to 2012, and changes in
financial condition and credit performance between December 31, 2013 and December 31, 2012 include the
following:
•Net Interest Income: Net interest income increased by $123 million, or 8%, to $1.7 billion in 2013. The increase
was primarily driven by growth in our commercial lending business and higher deposit balances.
•Non-Interest Income: Non-interest income increased by $55 million, or 16%, to $395 million in 2013, driven
by increased revenue related to fee-based products and services from the Beech Street Capital acquisition.
•Provision for Credit Losses: The benefit for credit losses decreased by $246 million, or 91%, to $24 million in
2013, compared to $270 million in 2012 due to the stabilization of the credit outlook which resulted in a lower
release of the allowance for loan and lease losses in 2013.
•Non-Interest Expense: Non-interest expense increased by $48 million, or 5%, to $958 million in 2013, driven
by investments in business growth and infrastructure enhancements and the costs associated with Beech Street
Capital.
•Loans Held for Investment: Period-end loans held for investment in our Commercial Banking business increased
by $6.2 billion, or 16%, in 2013, to $45.0 billion as of December 31, 2013, and average loans held for investment
increased by $4.9 billion, or 14%, to $40.8 billion in 2013, compared to $35.9 billion in 2012. The increases
were driven by strong loan originations in the commercial lending business, which was partially offset by the
continued run-off of the small-ticket commercial real estate loan portfolio.
•Deposits: Period-end deposits in the Commercial Banking business increased by $701 million, or 2%, to $30.6
billion as of December 31, 2013, from $29.9 billion as of December 31, 2012, driven by our strategy to
strengthen existing relationships and increase liquidity from commercial customers.
•Net Charge-off Statistics: The net charge-off rate decreased to 0.03% in 2013, from 0.12% in 2012. The
nonperforming loan rate decreased to 0.33% as of December 31, 2013, from 0.73% as of December 31, 2012.
The continued strength in the credit metrics in our Commercial Banking business reflected stable credit trends
and underlying collateral values.
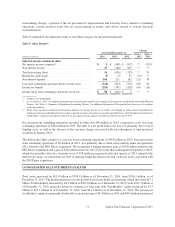
Other Category
Other includes unallocated amounts related to our centralized Corporate Treasury group activities, such as
management of our corporate investment portfolio and asset/liability management, gains and losses on our investment
securities portfolio and certain trading activities. Other also includes foreign exchange-rate fluctuations on foreign
currency-denominated transactions; certain gains and losses on the sale and securitization of loans; unallocated
corporate expenses that do not directly support the operations of the business segments or for which the business
segments are not considered financially accountable in evaluating their performance, such as certain acquisition and
70 Capital One Financial Corporation (COF)