Capital One 2014 Annual Report Download - page 17
Download and view the complete annual report
Please find page 17 of the 2014 Capital One annual report below. You can navigate through the pages in the report by either clicking on the pages listed below, or by using the keyword search tool below to find specific information within the annual report.-
 1
1 -
2
-
3
-
4
-
5
-
6
-
 7
7 -
 8
8 -
 9
9 -
 10
10 -
 11
11 -
 12
12 -
 13
13 -
 14
14 -
 15
15 -
 16
16 -
 17
17 -
 18
18 -
 19
19 -
 20
20 -
 21
21 -
 22
22 -
 23
23 -
 24
24 -
 25
25 -
 26
26 -
 27
27 -
28
-
29
-
30
-
31
-
32
-
33
-
34
-
35
-
36
-
37
-
38
-
39
-
40
-
41
-
42
-
43
-
44
-
45
-
46
-
47
-
48
-
49
-
50
-
51
-
52
-
53
-
54
-
55
-
56
-
57
-
58
-
59
-
60
-
61
-
62
-
63
-
64
-
65
-
66
-
67
-
68
-
69
-
70
-
71
-
72
-
73
-
74
-
75
-
76
-
77
-
78
-
79
-
80
-
81
-
82
-
83
-
84
-
85
-
86
-
87
-
88
-
89
-
90
-
91
-
92
-
93
-
94
-
95
-
96
-
97
-
98
-
99
-
100
-
101
-
102
-
103
-
104
-
105
-
106
-
107
-
108
-
109
-
110
-
111
-
112
-
113
-
114
-
115
-
116
-
117
-
118
-
119
-
120
-
121
-
122
-
123
-
124
-
125
-
126
-
127
-
128
-
129
-
130
-
131
-
132
-
133
-
134
-
135
-
136
-
137
-
138
-
139
-
140
-
141
-
142
-
143
-
144
-
145
-
146
-
147
-
148
-
149
-
150
-
151
-
152
-
153
-
154
-
155
-
156
-
157
-
158
-
159
-
160
-
161
-
162
-
163
-
164
-
165
-
166
-
167
-
168
-
169
-
170
-
171
-
172
-
173
-
174
-
175
-
176
-
177
-
178
-
179
-
180
-
181
-
182
-
183
-
184
-
185
-
186
-
187
-
188
-
189
-
190
-
191
-
192
-
193
-
194
-
195
-
196
-
197
-
198
-
199
-
200
-
201
-
202
-
203
-
204
-
205
-
206
-
207
-
208
-
209
-
210
-
211
-
212
-
213
-
214
-
215
-
216
-
217
-
218
-
219
-
220
-
221
-
222
-
223
-
224
-
225
-
226
-
227
-
228
-
229
-
230
-
231
-
232
-
233
-
234
-
235
-
236
-
237
-
238
-
239
-
240
-
241
-
242
-
243
-
244
-
245
-
246
-
247
-
248
-
249
-
250
-
251
-
252
-
253
-
254
-
255
-
256
-
257
-
258
-
259
-
260
-
261
-
262
-
263
-
264
-
265
-
266
-
267
-
268
-
269
-
270
-
271
-
272
-
273
-
274
-
275
-
276
-
277
-
278
-
279
-
280
-
281
-
282
-
283
-
284
-
285
-
286
-
287
-
288
-
289
-
290
-
291
-
292
-
293
-
294
-
295
-
296
-
297
-
298
-
299
-
300
 |
 |

15
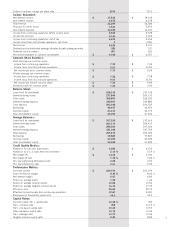
Dollars in millions, except per share data 2014 2013
Income Statement:
Net interest income $ 17,818 $ 18,106
Non-interest income 4,472 4,278
Total revenue 22,290 22,384
Provision for credit losses 3,541 3,453
Non-interest expense 12,180 12,353
Income from continuing operations before income taxes 6,569 6,578
Income tax provision 2,146 2,224
Income from continuing operations, net of tax 4,423 4,354
Income (loss) from discontinued operations, net of tax 5 (233)
Net income 4,428 4,121
Dividends and undistributed earnings allocated to participating securities (18) (17)
Preferred stock dividends (67) (53)
Net income available to common stockholders $ 4,343 $ 4,051
Common Share Statistics:
Basic earnings per common share:
Income from continuing operations $ 7.70 $ 7.39
Income (loss) from discontinued operations 0.01 (0.40)
Net income per basic common share $ 7.71 $ 6.99
Diluted earnings per common share:
Income from continuing operations $ 7.58 $ 7.28
Income (loss) from discontinued operations 0.01 (0.39)
Net income per diluted common share $ 7.59 $ 6.89
Dividends paid per common share $ 1.20 $ 0.95
Balance Sheet:
Loans held for investment $ 208,316 $ 197,199
Interest-earning assets 277,849 265,170
Total assets 308,854 296,933
Interest-bearing deposits 180,467 181,880
Total deposits 205,548 204,523
Borrowings 48,457 40,654
Common equity 43,231 40,779
Total stockholders’ equity 45,053 41,632
Average Balances:
Loans held for investment $ 197,925 $ 192,614
Interest-earning assets 267,174 266,423
Total assets 298,300 297,264
Interest-bearing deposits 181,036 187,700
Total deposits 205,675 209,045
Borrowings 38,882 37,807
Common equity 43,055 40,629
Total stockholders’ equity 44,268 41,482
Credit Quality Metrics:
Allowance for loan and lease losses $ 4,383 $ 4,315
Allowance as a % of loans held for investment 2.10 % 2.19 %
Net charge-offs $ 3,414 $ 3,934
Net charge-off rate 1.72 % 2.04 %
30+ day performing delinquency rate 2.62 2.63
30+ day delinquency rate 2.91 2.96
Performance Metrics:
Purchase volume $ 224,750 $ 201,074
Total net revenue margin 8.34 % 8.40 %
Net interest margin 6.67 6.80
Return on average assets 1.48 1.46
Return on average common equity 10.08 10.54
Return on average tangible common equity 15.79 17.35
Efficiency ratio 54.64 55.19
Effective income tax rate from continuing operations 32.67 33.81
Employees (in thousands), period end 46.0 45.4
Capital Ratios:
Common equity Tier 1 capital ratio 12.46 % N/A
Tier 1 common ratio N/A 12.19 %
Tier 1 risk-based capital ratio 13.23 12.57
Total risk-based capital ratio 15.14 14.69
Tier 1 leverage ratio 10.77 10.06
Tangible common equity ratio 9.49 8.89