Capital One 2014 Annual Report Download - page 238
Download and view the complete annual report
Please find page 238 of the 2014 Capital One annual report below. You can navigate through the pages in the report by either clicking on the pages listed below, or by using the keyword search tool below to find specific information within the annual report.-
 1
1 -
2
-
3
-
4
-
5
-
6
-
7
-
8
-
9
-
10
-
11
-
12
-
13
-
14
-
15
-
16
-
17
-
18
-
19
-
20
-
21
-
22
-
23
-
24
-
25
-
26
-
27
-
28
-
29
-
30
-
31
-
32
-
33
-
34
-
35
-
36
-
37
-
38
-
39
-
40
-
41
-
42
-
43
-
44
-
45
-
46
-
47
-
48
-
49
-
50
-
51
-
52
-
53
-
54
-
55
-
56
-
57
-
58
-
59
-
60
-
61
-
62
-
63
-
64
-
65
-
66
-
67
-
68
-
69
-
70
-
71
-
72
-
73
-
74
-
75
-
76
-
77
-
78
-
79
-
80
-
81
-
82
-
83
-
84
-
85
-
86
-
87
-
88
-
89
-
90
-
91
-
92
-
93
-
94
-
95
-
96
-
97
-
98
-
99
-
100
-
101
-
102
-
103
-
104
-
105
-
106
-
107
-
108
-
109
-
110
-
111
-
112
-
113
-
114
-
115
-
116
-
117
-
118
-
119
-
120
-
121
-
122
-
123
-
124
-
125
-
126
-
127
-
128
-
129
-
130
-
131
-
132
-
133
-
134
-
135
-
136
-
137
-
138
-
139
-
140
-
141
-
142
-
143
-
144
-
145
-
146
-
147
-
148
-
149
-
150
-
151
-
152
-
153
-
154
-
155
-
156
-
157
-
158
-
159
-
160
-
161
-
162
-
163
-
164
-
165
-
166
-
167
-
168
-
169
-
170
-
171
-
172
-
173
-
174
-
175
-
176
-
177
-
178
-
179
-
180
-
181
-
182
-
183
-
184
-
185
-
186
-
187
-
188
-
189
-
190
-
191
-
192
-
193
-
194
-
195
-
196
-
197
-
198
-
199
-
200
-
201
-
202
-
203
-
204
-
205
-
206
-
207
-
208
-
209
-
210
-
211
-
212
-
213
-
214
-
215
-
216
-
217
-
218
-
219
-
220
-
221
-
222
-
223
-
224
-
225
-
226
-
227
-
 228
228 -
 229
229 -
 230
230 -
 231
231 -
 232
232 -
 233
233 -
 234
234 -
 235
235 -
 236
236 -
 237
237 -
 238
238 -
 239
239 -
 240
240 -
 241
241 -
 242
242 -
 243
243 -
 244
244 -
 245
245 -
 246
246 -
 247
247 -
 248
248 -
249
-
250
-
251
-
252
-
253
-
254
-
255
-
256
-
257
-
258
-
259
-
260
-
261
-
262
-
263
-
264
-
265
-
266
-
267
-
268
-
269
-
270
-
271
-
272
-
273
-
274
-
275
-
276
-
277
-
278
-
279
-
280
-
281
-
282
-
283
-
284
-
285
-
286
-
287
-
288
-
289
-
290
-
291
-
292
-
293
-
294
-
295
-
296
-
297
-
298
-
299
-
300
 |
 |

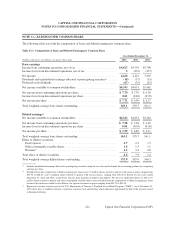
The following table presents a summary of 2014 activity for RSAs and RSUs.
Table 15.4: Summary of Restricted Stock Awards and Units
Restricted Stock Awards Restricted Stock Units
Weighted-Average Weighted-Average
Grant Date Grant Date
Fair Value Fair Value
(Shares/units in thousands) Shares per Share Units per Unit
Unvested as of January 1, 2014 . . . . . . . . . . . . . . . . . 1,668 $ 53.86 520 $ 50.52
Granted . . . . . . . . . . . . . . . . . . . . . . . . . . . . . . . . . . . . 0 0.00 1,128 72.12
Vested . . . . . . . . . . . . . . . . . . . . . . . . . . . . . . . . . . . . . (797) 50.45 (68) 45.97
Forfeited . . . . . . . . . . . . . . . . . . . . . . . . . . . . . . . . . . . (77) 54.06 (94) 70.52
Unvested as of December 31, 2014 . . . . . . . . . . . . . . 794 $ 57.28 1,486 $ 65.86
There were no new RSA grants in 2014. The weighted-average grant date fair value of RSAs in 2013 and 2012 was
$58.93 and $46.64, respectively. The total fair value of RSAs that vested during 2014, 2013, and 2012 was $57
million, $56 million and $102 million, respectively. The unrecognized compensation expense related to unvested
RSAs as of December 31, 2014 was $25 million, which is expected to be amortized over a weighted-average period
of 1.6 years.
The weighted-average grant date fair value of RSUs in 2014, 2013 and 2012 was $72.12, $58.10 and $52.17,
respectively. The total fair value of RSUs that vested during 2014, 2013, and 2012 was $5 million, $6 million and
$5 million, respectively. The unrecognized compensation expense related to unvested RSUs as of December 31,
2014 was $44 million, which is expected to be amortized over a weighted-average period of 2.1 years.
Performance Share Awards and Units
PSAs and PSUs are granted to certain employees at no cost to the recipient, and generally vest over three years from
the date of grant, however some PSUs cliff vest on or shortly after the third anniversary of the grant date. Generally,
the value of PSAs and PSUs will equal the fair market value of our common stock on the date of grant and the
expense is recognized over the vesting period. A recipient of a PSA is entitled to voting rights and is generally
entitled to dividends on the common stock. A recipient of a PSU is entitled to receive a share of common stock after
the applicable restrictions lapse. Additionally, a recipient of a PSU is generally entitled to receive cash payments or
additional shares of common stock equivalent to any dividends paid on the underlying common stock during the
period the PSU is outstanding, but is not entitled to voting rights.
The number of PSAs that vest each year can be reduced by 50% or 100% depending on whether specific performance
goals are met during the vesting period.
The number of PSUs that will ultimately vest is contingent upon meeting specific performance goals over a three-
year period. Certain PSUs granted in 2014 and all PSUs granted in 2013 include an opportunity to receive from 0%
to 150% of the target number of common shares, while the PSUs granted in 2012 include an opportunity to receive
from 0% to 200% of the target number of common shares.
216
CAPITAL ONE FINANCIAL CORPORATION
NOTES TO CONSOLIDATED FINANCIAL STATEMENTS—(Continued)
Capital One Financial Corporation (COF)