Capital One 2014 Annual Report Download - page 58
Download and view the complete annual report
Please find page 58 of the 2014 Capital One annual report below. You can navigate through the pages in the report by either clicking on the pages listed below, or by using the keyword search tool below to find specific information within the annual report.-
 1
1 -
2
-
3
-
4
-
5
-
6
-
7
-
8
-
9
-
10
-
11
-
12
-
13
-
14
-
15
-
16
-
17
-
18
-
19
-
20
-
21
-
22
-
23
-
24
-
25
-
26
-
27
-
28
-
29
-
30
-
31
-
32
-
33
-
34
-
35
-
36
-
37
-
38
-
39
-
40
-
41
-
42
-
43
-
44
-
45
-
46
-
47
-
 48
48 -
 49
49 -
 50
50 -
 51
51 -
 52
52 -
 53
53 -
 54
54 -
 55
55 -
 56
56 -
 57
57 -
 58
58 -
 59
59 -
 60
60 -
 61
61 -
 62
62 -
 63
63 -
 64
64 -
 65
65 -
 66
66 -
 67
67 -
 68
68 -
69
-
70
-
71
-
72
-
73
-
74
-
75
-
76
-
77
-
78
-
79
-
80
-
81
-
82
-
83
-
84
-
85
-
86
-
87
-
88
-
89
-
90
-
91
-
92
-
93
-
94
-
95
-
96
-
97
-
98
-
99
-
100
-
101
-
102
-
103
-
104
-
105
-
106
-
107
-
108
-
109
-
110
-
111
-
112
-
113
-
114
-
115
-
116
-
117
-
118
-
119
-
120
-
121
-
122
-
123
-
124
-
125
-
126
-
127
-
128
-
129
-
130
-
131
-
132
-
133
-
134
-
135
-
136
-
137
-
138
-
139
-
140
-
141
-
142
-
143
-
144
-
145
-
146
-
147
-
148
-
149
-
150
-
151
-
152
-
153
-
154
-
155
-
156
-
157
-
158
-
159
-
160
-
161
-
162
-
163
-
164
-
165
-
166
-
167
-
168
-
169
-
170
-
171
-
172
-
173
-
174
-
175
-
176
-
177
-
178
-
179
-
180
-
181
-
182
-
183
-
184
-
185
-
186
-
187
-
188
-
189
-
190
-
191
-
192
-
193
-
194
-
195
-
196
-
197
-
198
-
199
-
200
-
201
-
202
-
203
-
204
-
205
-
206
-
207
-
208
-
209
-
210
-
211
-
212
-
213
-
214
-
215
-
216
-
217
-
218
-
219
-
220
-
221
-
222
-
223
-
224
-
225
-
226
-
227
-
228
-
229
-
230
-
231
-
232
-
233
-
234
-
235
-
236
-
237
-
238
-
239
-
240
-
241
-
242
-
243
-
244
-
245
-
246
-
247
-
248
-
249
-
250
-
251
-
252
-
253
-
254
-
255
-
256
-
257
-
258
-
259
-
260
-
261
-
262
-
263
-
264
-
265
-
266
-
267
-
268
-
269
-
270
-
271
-
272
-
273
-
274
-
275
-
276
-
277
-
278
-
279
-
280
-
281
-
282
-
283
-
284
-
285
-
286
-
287
-
288
-
289
-
290
-
291
-
292
-
293
-
294
-
295
-
296
-
297
-
298
-
299
-
300
 |
 |

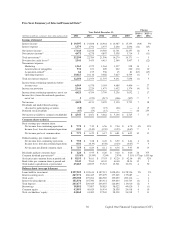
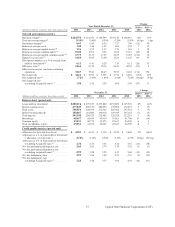
Five-Year Summary of Selected Financial Data(1)
Change
Year Ended December 31, 2014 vs. 2013 vs.
(Dollars in millions, except per share data and as noted) 2014 2013 2012 2011 2010 2013 2012
Income statement
Interest income . . . . . . . . . . . . . . . . . . . . . . . . $ 19,397 $ 19,898 $ 18,964 $ 14,987 $ 15,353 (3)% 5%
Interest expense . . . . . . . . . . . . . . . . . . . . . . . . 1,579 1,792 2,375 2,246 2,896 (12) (25)
Net interest income . . . . . . . . . . . . . . . . . . . . . 17,818 18,106 16,589 12,741 12,457 (2) 9
Non-interest income(2) . . . . . . . . . . . . . . . . . . . 4,472 4,278 4,807 3,538 3,714 5 (11)
Total net revenue(3) . . . . . . . . . . . . . . . . . . . . . . 22,290 22,384 21,396 16,279 16,171 — 5
Provision for credit losses(4) . . . . . . . . . . . . . . 3,541 3,453 4,415 2,360 3,907 3 (22)
Non-interest expense:
Marketing . . . . . . . . . . . . . . . . . . . . . . . . . . 1,561 1,373 1,364 1,337 958 14 1
Amortization of intangibles . . . . . . . . . . . . 532 671 609 222 220 (21) 10
Acquisition-related(5) . . . . . . . . . . . . . . . . . . 64 193 336 45 81 (67) (43)
Operating expenses . . . . . . . . . . . . . . . . . . . 10,023 10,116 9,488 7,627 6,599 (1) 7
Total non-interest expense . . . . . . . . . . . . . . . . 12,180 12,353 11,797 9,231 7,858 (1) 5
Income from continuing operations before
income taxes . . . . . . . . . . . . . . . . . . . . . . . . 6,569 6,578 5,184 4,688 4,406 — 27
Income tax provision . . . . . . . . . . . . . . . . . . . . 2,146 2,224 1,475 1,452 1,374 (4) 51
Income from continuing operations, net of tax 4,423 4,354 3,709 3,236 3,032 2 17
Income (loss) from discontinued operations,
net of tax . . . . . . . . . . . . . . . . . . . . . . . . . . . 5(233) (217) (106) (307) ** 7
Net income . . . . . . . . . . . . . . . . . . . . . . . . . . . 4,428 4,121 3,492 3,130 2,725 7 18
Dividends and undistributed earnings
allocated to participating securities . . . . . . . (18) (17) (15) (26) — 6 13
Preferred stock dividends . . . . . . . . . . . . . . . . (67) (53) (15) — — 26 253
Net income available to common stockholders $ 4,343 $ 4,051 $ 3,462 $ 3,104 $ 2,725 7 17
Common share statistics
Basic earnings per common share:
Net income from continuing operations . . . $ 7.70 $ 7.39 $ 6.56 $ 7.04 $ 6.70 4% 13%
Income (loss) from discontinued operations 0.01 (0.40) (0.39) (0.23) (0.67) ** 3
Net income per basic common share . . . . . $ 7.71 $ 6.99 $ 6.17 $ 6.81 $ 6.03 10 13
Diluted earnings per common share:
Net income from continuing operations . . . $ 7.58 $ 7.28 $ 6.49 $ 6.99 $ 6.64 4 12
Income (loss) from discontinued operations 0.01 (0.39) (0.38) (0.23) (0.67) ** 3
Net income per diluted common share . . . . $ 7.59 $ 6.89 $ 6.11 $ 6.76 $ 5.97 10 13
Dividends paid per common share . . . . . . . . . $ 1.20 $ 0.95 $ 0.20 $ 0.20 $ 0.20 26 375
Common dividend payout ratio(6) . . . . . . . . . . 15.56% 13.59% 3.24% 2.93% 3.31% 197 bps 1,035 bps
Stock price per common share at period end . $ 82.55 $ 76.61 $ 57.93 $ 42.29 $ 42.56 8% 32%
Book value per common share at period end . 81.41 72.69 69.43 64.40 58.54 12 5
Total market capitalization at period end . . . . 45,683 43,875 33,727 19,301 19,271 4 30
Balance sheet (average balances)
Loans held for investment . . . . . . . . . . . . . . . . $197,925 $ 192,614 $ 187,915 $128,424 $ 128,526 3% 3%
Interest-earning assets . . . . . . . . . . . . . . . . . . . 267,174 266,423 255,079 175,265 175,683 — 4
Total assets . . . . . . . . . . . . . . . . . . . . . . . . . . . 298,300 297,264 286,585 199,699 200,116 — 4
Interest-bearing deposits . . . . . . . . . . . . . . . . . 181,036 187,700 183,314 109,644 104,743 (4) 2
Total deposits . . . . . . . . . . . . . . . . . . . . . . . . . . 205,675 209,045 203,055 126,694 119,010 (2) 3
Borrowings . . . . . . . . . . . . . . . . . . . . . . . . . . . 38,882 37,807 38,025 38,022 49,620 3 (1)
Common equity . . . . . . . . . . . . . . . . . . . . . . . . 43,055 40,629 36,934 28,538 24,918 6 10
Total stockholders’ equity . . . . . . . . . . . . . . . . 44,268 41,482 37,265 28,538 24,918 7 11
36 Capital One Financial Corporation (COF)