Capital One 2014 Annual Report Download - page 77
Download and view the complete annual report
Please find page 77 of the 2014 Capital One annual report below. You can navigate through the pages in the report by either clicking on the pages listed below, or by using the keyword search tool below to find specific information within the annual report.-
 1
1 -
2
-
3
-
4
-
5
-
6
-
7
-
8
-
9
-
10
-
11
-
12
-
13
-
14
-
15
-
16
-
17
-
18
-
19
-
20
-
21
-
22
-
23
-
24
-
25
-
26
-
27
-
28
-
29
-
30
-
31
-
32
-
33
-
34
-
35
-
36
-
37
-
38
-
39
-
40
-
41
-
42
-
43
-
44
-
45
-
46
-
47
-
48
-
49
-
50
-
51
-
52
-
53
-
54
-
55
-
56
-
57
-
58
-
59
-
60
-
61
-
62
-
63
-
64
-
65
-
66
-
 67
67 -
 68
68 -
 69
69 -
 70
70 -
 71
71 -
 72
72 -
 73
73 -
 74
74 -
 75
75 -
 76
76 -
 77
77 -
 78
78 -
 79
79 -
 80
80 -
 81
81 -
 82
82 -
 83
83 -
 84
84 -
 85
85 -
 86
86 -
 87
87 -
88
-
89
-
90
-
91
-
92
-
93
-
94
-
95
-
96
-
97
-
98
-
99
-
100
-
101
-
102
-
103
-
104
-
105
-
106
-
107
-
108
-
109
-
110
-
111
-
112
-
113
-
114
-
115
-
116
-
117
-
118
-
119
-
120
-
121
-
122
-
123
-
124
-
125
-
126
-
127
-
128
-
129
-
130
-
131
-
132
-
133
-
134
-
135
-
136
-
137
-
138
-
139
-
140
-
141
-
142
-
143
-
144
-
145
-
146
-
147
-
148
-
149
-
150
-
151
-
152
-
153
-
154
-
155
-
156
-
157
-
158
-
159
-
160
-
161
-
162
-
163
-
164
-
165
-
166
-
167
-
168
-
169
-
170
-
171
-
172
-
173
-
174
-
175
-
176
-
177
-
178
-
179
-
180
-
181
-
182
-
183
-
184
-
185
-
186
-
187
-
188
-
189
-
190
-
191
-
192
-
193
-
194
-
195
-
196
-
197
-
198
-
199
-
200
-
201
-
202
-
203
-
204
-
205
-
206
-
207
-
208
-
209
-
210
-
211
-
212
-
213
-
214
-
215
-
216
-
217
-
218
-
219
-
220
-
221
-
222
-
223
-
224
-
225
-
226
-
227
-
228
-
229
-
230
-
231
-
232
-
233
-
234
-
235
-
236
-
237
-
238
-
239
-
240
-
241
-
242
-
243
-
244
-
245
-
246
-
247
-
248
-
249
-
250
-
251
-
252
-
253
-
254
-
255
-
256
-
257
-
258
-
259
-
260
-
261
-
262
-
263
-
264
-
265
-
266
-
267
-
268
-
269
-
270
-
271
-
272
-
273
-
274
-
275
-
276
-
277
-
278
-
279
-
280
-
281
-
282
-
283
-
284
-
285
-
286
-
287
-
288
-
289
-
290
-
291
-
292
-
293
-
294
-
295
-
296
-
297
-
298
-
299
-
300
 |
 |

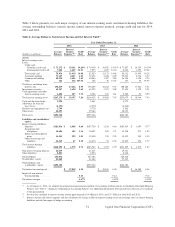
delinquency inventories in our domestic card, which were observed in 2014; partially offset by lower net charge-
offs of $520 million in 2014, as compared to 2013, mainly due to continued economic improvement and portfolio
seasoning in our credit card loan portfolio.
The decrease in the provision for credit losses of $962 million in 2013, from 2012, was driven by the absence of the
provision for credit losses of $1.2 billion recorded in the second quarter of 2012 to establish an allowance for credit
card loans acquired in the 2012 U.S. card acquisition, and lower provision for credit losses in our non-acquired portfolio
as underlying credit improved. This was partially offset by (i) an increase in charge-offs on the portfolio of Acquired
Loans, as the Acquired Loans have run-off and have been replaced with originated loans which do not have a credit
mark to absorb the charge-offs; (ii) a lower allowance release in our Commercial Banking business due to
stabilization of the credit outlook in 2013 compared to 2012; and (iii) higher charge-offs on our auto loan portfolio
in our Consumer Banking segment reflecting portfolio growth and increased charge off rates from historically low
levels.
We provide additional information on the provision for credit losses and changes in the allowance for loan and lease
losses within “Credit Risk Profile—Summary of Allowance for Loan and Lease Losses,” “Note 4—Loans” and
“Note 5—Allowance for Loan and Lease Losses.” For information on the allowance methodology for each of our
loan categories, see “Note 1—Summary of Significant Accounting Policies.”
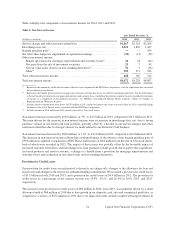
Non-Interest Expense
Non-interest expense consists of ongoing operating costs, such as salaries and associate benefits, occupancy and
equipment costs, professional services, communications and data processing expenses and other miscellaneous
expenses, as well as marketing costs, acquisition-related expenses and amortization of intangibles.
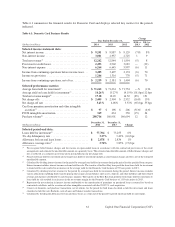
Table 5 displays the components of non-interest expense for 2014, 2013 and 2012.
Table 5: Non-Interest Expense(1)(2)
Year Ended December 31,
(Dollars in millions) 2014 2013 2012
Salaries and associate benefits . . . . . . . . . . . . . . . . . . . . . . . . . . . . . . . . . . . . . . . . . $ 4,593 $ 4,480 $ 3,991
Occupancy and equipment . . . . . . . . . . . . . . . . . . . . . . . . . . . . . . . . . . . . . . . . . . . . 1,745 1,541 1,358
Marketing . . . . . . . . . . . . . . . . . . . . . . . . . . . . . . . . . . . . . . . . . . . . . . . . . . . . . . . . . 1,561 1,373 1,366
Professional services . . . . . . . . . . . . . . . . . . . . . . . . . . . . . . . . . . . . . . . . . . . . . . . . 1,216 1,347 1,417
Communications and data processing . . . . . . . . . . . . . . . . . . . . . . . . . . . . . . . . . . . 798 897 807
Amortization of intangibles . . . . . . . . . . . . . . . . . . . . . . . . . . . . . . . . . . . . . . . . . . . 532 671 609
Other non-interest expense:
Collections . . . . . . . . . . . . . . . . . . . . . . . . . . . . . . . . . . . . . . . . . . . . . . . . . . . . . 372 470 544
Fraud losses . . . . . . . . . . . . . . . . . . . . . . . . . . . . . . . . . . . . . . . . . . . . . . . . . . . . . 275 218 190
Bankcard, regulatory and other fee assessments . . . . . . . . . . . . . . . . . . . . . . . . . 465 562 525
Other . . . . . . . . . . . . . . . . . . . . . . . . . . . . . . . . . . . . . . . . . . . . . . . . . . . . . . . . . . 623 794 990
Other non-interest expense . . . . . . . . . . . . . . . . . . . . . . . . . . . . . . . . . . . . . . . . . . . 1,735 2,044 2,249
Total non-interest expense . . . . . . . . . . . . . . . . . . . . . . . . . . . . . . . . . . . . . . . . . . . . $12,180 $12,353 $11,797
(1) As of January 1, 2014, we adopted the proportional amortization method of accounting for Investments in Qualified Affordable Housing
Projects. See “Note 1—Summary of Significant Accounting Policies” for additional information. Prior periods have been recast to conform
to this presentation.
(2) Includes acquisition-related costs of $64 million, $193 million and $336 million in 2014, 2013 and 2012, respectively. These amounts are
comprised of transaction costs, legal and other professional or consulting fees, restructuring costs, and integration expense.
55 Capital One Financial Corporation (COF)