Capital One 2014 Annual Report Download - page 188
Download and view the complete annual report
Please find page 188 of the 2014 Capital One annual report below. You can navigate through the pages in the report by either clicking on the pages listed below, or by using the keyword search tool below to find specific information within the annual report.-
 1
1 -
2
-
3
-
4
-
5
-
6
-
7
-
8
-
9
-
10
-
11
-
12
-
13
-
14
-
15
-
16
-
17
-
18
-
19
-
20
-
21
-
22
-
23
-
24
-
25
-
26
-
27
-
28
-
29
-
30
-
31
-
32
-
33
-
34
-
35
-
36
-
37
-
38
-
39
-
40
-
41
-
42
-
43
-
44
-
45
-
46
-
47
-
48
-
49
-
50
-
51
-
52
-
53
-
54
-
55
-
56
-
57
-
58
-
59
-
60
-
61
-
62
-
63
-
64
-
65
-
66
-
67
-
68
-
69
-
70
-
71
-
72
-
73
-
74
-
75
-
76
-
77
-
78
-
79
-
80
-
81
-
82
-
83
-
84
-
85
-
86
-
87
-
88
-
89
-
90
-
91
-
92
-
93
-
94
-
95
-
96
-
97
-
98
-
99
-
100
-
101
-
102
-
103
-
104
-
105
-
106
-
107
-
108
-
109
-
110
-
111
-
112
-
113
-
114
-
115
-
116
-
117
-
118
-
119
-
120
-
121
-
122
-
123
-
124
-
125
-
126
-
127
-
128
-
129
-
130
-
131
-
132
-
133
-
134
-
135
-
136
-
137
-
138
-
139
-
140
-
141
-
142
-
143
-
144
-
145
-
146
-
147
-
148
-
149
-
150
-
151
-
152
-
153
-
154
-
155
-
156
-
157
-
158
-
159
-
160
-
161
-
162
-
163
-
164
-
165
-
166
-
167
-
168
-
169
-
170
-
171
-
172
-
173
-
174
-
175
-
176
-
177
-
 178
178 -
 179
179 -
 180
180 -
 181
181 -
 182
182 -
 183
183 -
 184
184 -
 185
185 -
 186
186 -
 187
187 -
 188
188 -
 189
189 -
 190
190 -
 191
191 -
 192
192 -
 193
193 -
 194
194 -
 195
195 -
 196
196 -
 197
197 -
 198
198 -
199
-
200
-
201
-
202
-
203
-
204
-
205
-
206
-
207
-
208
-
209
-
210
-
211
-
212
-
213
-
214
-
215
-
216
-
217
-
218
-
219
-
220
-
221
-
222
-
223
-
224
-
225
-
226
-
227
-
228
-
229
-
230
-
231
-
232
-
233
-
234
-
235
-
236
-
237
-
238
-
239
-
240
-
241
-
242
-
243
-
244
-
245
-
246
-
247
-
248
-
249
-
250
-
251
-
252
-
253
-
254
-
255
-
256
-
257
-
258
-
259
-
260
-
261
-
262
-
263
-
264
-
265
-
266
-
267
-
268
-
269
-
270
-
271
-
272
-
273
-
274
-
275
-
276
-
277
-
278
-
279
-
280
-
281
-
282
-
283
-
284
-
285
-
286
-
287
-
288
-
289
-
290
-
291
-
292
-
293
-
294
-
295
-
296
-
297
-
298
-
299
-
300
 |
 |

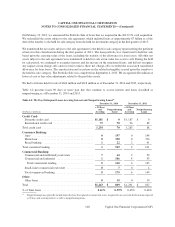
166
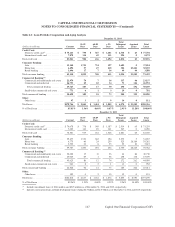
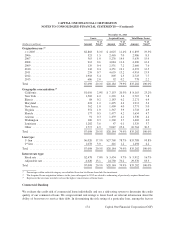
NOTE 4—LOANS
Loan Portfolio Composition
Our loan portfolio consists of loans held for investment, including restricted loans underlying our consolidated
securitization trusts, and loans held for sale, and is divided into three portfolio segments: credit card, consumer
banking and commercial banking loans. Credit card loans consist of domestic and international credit card loans.
Consumer banking loans consist of auto, home and retail banking loans. Commercial banking loans consist of
commercial and multifamily real estate, commercial and industrial and small-ticket commercial real estate loans.
Our portfolio of loans held for investment also includes loans acquired in the ING Direct, CCB and 2012 U.S. card
acquisitions. These loans were recorded at fair value at the date of each acquisition and are referred to as Acquired
Loans. The substantial majority of the loans purchased in the 2012 U.S. card acquisition had existing revolving
privileges; therefore, they were excluded from the Acquired Loans and accounted for based on contractual cash
flows at acquisition. See “Note 1—Summary of Significant Accounting Policies” for additional information on
accounting guidance for these loans.
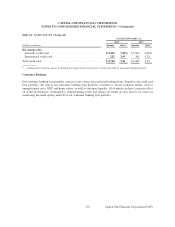
Credit Quality
We closely monitor economic conditions and loan performance trends to manage and evaluate our exposure to credit
risk. Trends in delinquency ratios are an indicator, among other considerations, of credit risk within our loan portfolio.
The level of nonperforming loans represents another indicator of the potential for future credit losses. Accordingly,
key metrics we track and use in evaluating the credit quality of our loan portfolio include delinquency and
nonperforming loan rates, as well as net charge-off rates and our internal risk ratings of larger balance commercial
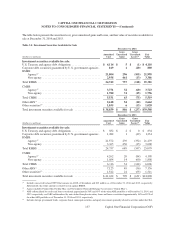
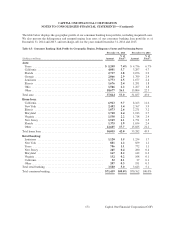
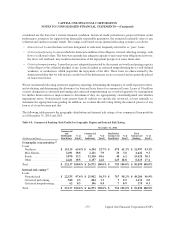
loans. The table below presents the composition and an aging analysis of our loans held for investment portfolio,
which includes restricted loans for securitization investors, as of December 31, 2014 and 2013. The delinquency
aging includes all past due loans, both performing and nonperforming.
CAPITAL ONE FINANCIAL CORPORATION
NOTES TO CONSOLIDATED FINANCIAL STATEMENTS—(Continued)
Capital One Financial Corporation (COF)