Capital One 2014 Annual Report Download - page 124
Download and view the complete annual report
Please find page 124 of the 2014 Capital One annual report below. You can navigate through the pages in the report by either clicking on the pages listed below, or by using the keyword search tool below to find specific information within the annual report.-
 1
1 -
2
-
3
-
4
-
5
-
6
-
7
-
8
-
9
-
10
-
11
-
12
-
13
-
14
-
15
-
16
-
17
-
18
-
19
-
20
-
21
-
22
-
23
-
24
-
25
-
26
-
27
-
28
-
29
-
30
-
31
-
32
-
33
-
34
-
35
-
36
-
37
-
38
-
39
-
40
-
41
-
42
-
43
-
44
-
45
-
46
-
47
-
48
-
49
-
50
-
51
-
52
-
53
-
54
-
55
-
56
-
57
-
58
-
59
-
60
-
61
-
62
-
63
-
64
-
65
-
66
-
67
-
68
-
69
-
70
-
71
-
72
-
73
-
74
-
75
-
76
-
77
-
78
-
79
-
80
-
81
-
82
-
83
-
84
-
85
-
86
-
87
-
88
-
89
-
90
-
91
-
92
-
93
-
94
-
95
-
96
-
97
-
98
-
99
-
100
-
101
-
102
-
103
-
104
-
105
-
106
-
107
-
108
-
109
-
110
-
111
-
112
-
113
-
 114
114 -
 115
115 -
 116
116 -
 117
117 -
 118
118 -
 119
119 -
 120
120 -
 121
121 -
 122
122 -
 123
123 -
 124
124 -
 125
125 -
 126
126 -
 127
127 -
 128
128 -
 129
129 -
 130
130 -
 131
131 -
 132
132 -
 133
133 -
 134
134 -
135
-
136
-
137
-
138
-
139
-
140
-
141
-
142
-
143
-
144
-
145
-
146
-
147
-
148
-
149
-
150
-
151
-
152
-
153
-
154
-
155
-
156
-
157
-
158
-
159
-
160
-
161
-
162
-
163
-
164
-
165
-
166
-
167
-
168
-
169
-
170
-
171
-
172
-
173
-
174
-
175
-
176
-
177
-
178
-
179
-
180
-
181
-
182
-
183
-
184
-
185
-
186
-
187
-
188
-
189
-
190
-
191
-
192
-
193
-
194
-
195
-
196
-
197
-
198
-
199
-
200
-
201
-
202
-
203
-
204
-
205
-
206
-
207
-
208
-
209
-
210
-
211
-
212
-
213
-
214
-
215
-
216
-
217
-
218
-
219
-
220
-
221
-
222
-
223
-
224
-
225
-
226
-
227
-
228
-
229
-
230
-
231
-
232
-
233
-
234
-
235
-
236
-
237
-
238
-
239
-
240
-
241
-
242
-
243
-
244
-
245
-
246
-
247
-
248
-
249
-
250
-
251
-
252
-
253
-
254
-
255
-
256
-
257
-
258
-
259
-
260
-
261
-
262
-
263
-
264
-
265
-
266
-
267
-
268
-
269
-
270
-
271
-
272
-
273
-
274
-
275
-
276
-
277
-
278
-
279
-
280
-
281
-
282
-
283
-
284
-
285
-
286
-
287
-
288
-
289
-
290
-
291
-
292
-
293
-
294
-
295
-
296
-
297
-
298
-
299
-
300
 |
 |

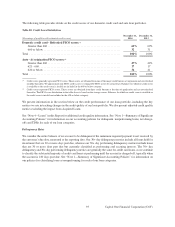
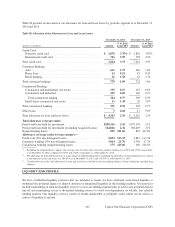
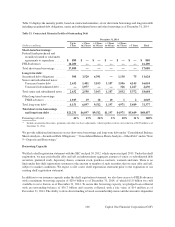
Table 29 below presents the composition of our liquidity reserves as of December 31, 2014 and 2013.
Table 29: Liquidity Reserves
December 31, December 31,
(Dollars in millions) 2014 2013
Cash and cash equivalents . . . . . . . . . . . . . . . . . . . . . . . . . . . . . . . . . . . . . . . . . . . . . . $ 7,242 $ 6,291
Investment securities available for sale, at fair value . . . . . . . . . . . . . . . . . . . . . . . . . . 39,508 41,800
Investment securities held to maturity, at fair value . . . . . . . . . . . . . . . . . . . . . . . . . . . 23,634 19,185
Total investment securities portfolio(1)(2) . . . . . . . . . . . . . . . . . . . . . . . . . . . . . . . . . . 63,142 60,985
FHLB borrowing capacity secured by loans . . . . . . . . . . . . . . . . . . . . . . . . . . . . . . . . 29,547 28,623
Outstanding FHLB advances and letters of credit secured by loans . . . . . . . . . . . . . . (17,720) (8,917)
Outstanding FHLB advances and letters of credit secured by securities . . . . . . . . . . . (4) (7,808)
Securities encumbered for Public Funds and others . . . . . . . . . . . . . . . . . . . . . . . . . . (10,627) (9,491)
Total liquidity reserves . . . . . . . . . . . . . . . . . . . . . . . . . . . . . . . . . . . . . . . . . . . . . . . . . $ 71,580 $ 69,683
(1) The weighted average life of our securities was approximately 5.7 years and 6.3 years as of December 31, 2014, and 2013, respectively.
(2) We pledged securities available for sale with a fair value of $3.5 billion and $10.7 billion as of December 31, 2014 and 2013, respectively.
We also pledged securities held to maturity with a carrying value of $9.0 billion and $8.2 billion as of December 31, 2014 and 2013,
respectively. As of December 31, 2014, $14 million of the pledged securities available for sale were used to secure our FHLB borrowing
capacity.
Our liquidity reserves increased by $1.9 billion, or 3%, to $71.6 billion as of December 31, 2014, from $69.7 billion
as of December 31, 2013. This increase was primarily attributable to an increase in the fair value of our investment
securities, partially offset by higher FHLB advances to fund the growth of our credit card portfolio. See “MD&A—
Risk Management” for additional information on our management of liquidity risk.
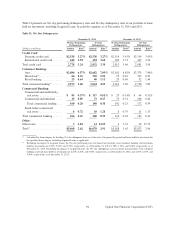
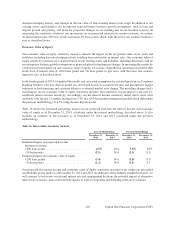
Funding
The Company’s primary source of funding comes from deposits. In addition to deposits, the Company raises funding
through the purchase of federal funds, the issuance of brokered deposits, FHLB advances secured by certain portions
of our loan and securities portfolios, the issuance of senior and subordinated notes, the issuance of securitized debt
obligations and other borrowings. A key objective in our use of these markets is to ensure we maintain access to a
diversified mix of wholesale funding sources.
Deposits
Our deposits provide a stable and relatively low cost of funds and are our largest source of funding.
102 Capital One Financial Corporation (COF)