Capital One 2014 Annual Report Download - page 85
Download and view the complete annual report
Please find page 85 of the 2014 Capital One annual report below. You can navigate through the pages in the report by either clicking on the pages listed below, or by using the keyword search tool below to find specific information within the annual report.-
 1
1 -
2
-
3
-
4
-
5
-
6
-
7
-
8
-
9
-
10
-
11
-
12
-
13
-
14
-
15
-
16
-
17
-
18
-
19
-
20
-
21
-
22
-
23
-
24
-
25
-
26
-
27
-
28
-
29
-
30
-
31
-
32
-
33
-
34
-
35
-
36
-
37
-
38
-
39
-
40
-
41
-
42
-
43
-
44
-
45
-
46
-
47
-
48
-
49
-
50
-
51
-
52
-
53
-
54
-
55
-
56
-
57
-
58
-
59
-
60
-
61
-
62
-
63
-
64
-
65
-
66
-
67
-
68
-
69
-
70
-
71
-
72
-
73
-
74
-
 75
75 -
 76
76 -
 77
77 -
 78
78 -
 79
79 -
 80
80 -
 81
81 -
 82
82 -
 83
83 -
 84
84 -
 85
85 -
 86
86 -
 87
87 -
 88
88 -
 89
89 -
 90
90 -
 91
91 -
 92
92 -
 93
93 -
 94
94 -
 95
95 -
96
-
97
-
98
-
99
-
100
-
101
-
102
-
103
-
104
-
105
-
106
-
107
-
108
-
109
-
110
-
111
-
112
-
113
-
114
-
115
-
116
-
117
-
118
-
119
-
120
-
121
-
122
-
123
-
124
-
125
-
126
-
127
-
128
-
129
-
130
-
131
-
132
-
133
-
134
-
135
-
136
-
137
-
138
-
139
-
140
-
141
-
142
-
143
-
144
-
145
-
146
-
147
-
148
-
149
-
150
-
151
-
152
-
153
-
154
-
155
-
156
-
157
-
158
-
159
-
160
-
161
-
162
-
163
-
164
-
165
-
166
-
167
-
168
-
169
-
170
-
171
-
172
-
173
-
174
-
175
-
176
-
177
-
178
-
179
-
180
-
181
-
182
-
183
-
184
-
185
-
186
-
187
-
188
-
189
-
190
-
191
-
192
-
193
-
194
-
195
-
196
-
197
-
198
-
199
-
200
-
201
-
202
-
203
-
204
-
205
-
206
-
207
-
208
-
209
-
210
-
211
-
212
-
213
-
214
-
215
-
216
-
217
-
218
-
219
-
220
-
221
-
222
-
223
-
224
-
225
-
226
-
227
-
228
-
229
-
230
-
231
-
232
-
233
-
234
-
235
-
236
-
237
-
238
-
239
-
240
-
241
-
242
-
243
-
244
-
245
-
246
-
247
-
248
-
249
-
250
-
251
-
252
-
253
-
254
-
255
-
256
-
257
-
258
-
259
-
260
-
261
-
262
-
263
-
264
-
265
-
266
-
267
-
268
-
269
-
270
-
271
-
272
-
273
-
274
-
275
-
276
-
277
-
278
-
279
-
280
-
281
-
282
-
283
-
284
-
285
-
286
-
287
-
288
-
289
-
290
-
291
-
292
-
293
-
294
-
295
-
296
-
297
-
298
-
299
-
300
 |
 |

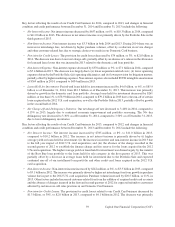
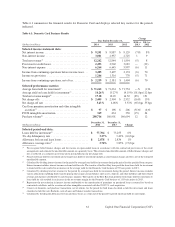
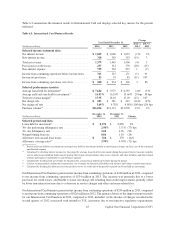
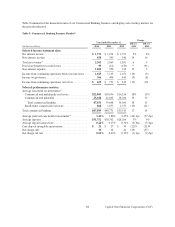
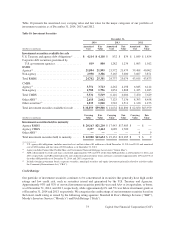
Table 6.2 summarizes the financial results for International Card and displays selected key metrics for the periods
indicated.
Table 6.2: International Card Business Results
Change
Year Ended December 31, 2014 vs. 2013 vs.
(Dollars in millions) 2014 2013 2012 2013 2012
Selected income statement data:
Net interest income . . . . . . . . . . . . . . . . . . . . . . . . . . . . . . . . $ 1,069 $ 1,080 $ 1,053 (1)% 3%
Non-interest income . . . . . . . . . . . . . . . . . . . . . . . . . . . . . . . 310 363 353 (15) 3
Total net revenue . . . . . . . . . . . . . . . . . . . . . . . . . . . . . . . . . . 1,379 1,443 1,406 (4) 3
Provision for credit losses . . . . . . . . . . . . . . . . . . . . . . . . . . . 257 322 378 (20) (15)
Non-interest expense . . . . . . . . . . . . . . . . . . . . . . . . . . . . . . 799 794 857 1 (7)
Income from continuing operations before income taxes . . . 323 327 171 (1) 91
Income tax provision . . . . . . . . . . . . . . . . . . . . . . . . . . . . . . 83 93 45 (11) 107
Income from continuing operations, net of tax . . . . . . . . . . . $ 240 $ 234 $ 126 3 86
Selected performance metrics:
Average loans held for investment
(1)
. . . . . . . . . . . . . . . . . . . $ 7,684 $ 7,973 $ 8,255 (4)% (3)%
Average yield on loans held for investment
(2)
. . . . . . . . . . . . 16.53% 16.24% 15.66% 29 bps 58 bps
Total net revenue margin
(3)
. . . . . . . . . . . . . . . . . . . . . . . . . . 17.95 18.10 17.03 (15) 107
Net charge-offs . . . . . . . . . . . . . . . . . . . . . . . . . . . . . . . . . . $ 283 $ 381 $ 412 (26)% (8)%
Net charge-off rate . . . . . . . . . . . . . . . . . . . . . . . . . . . . . . . . 3.69% 4.78% 4.98% (109) bps (20) bps
Purchase volume
(4)
. . . . . . . . . . . . . . . . . . . . . . . . . . . . . . . . $16,034 $14,173 $13,905 13% 2%
December 31, December 31,
(Dollars in millions) 2014 2013 Change
Selected period-end data:
Loans held for investment(1) . . . . . . . . . . . . . . . . . . . . . . . . . $ 8,172 $ 8,050 2%
30+ day performing delinquency rate . . . . . . . . . . . . . . . . . . 2.94% 3.71% (77) bps
30+ day delinquency rate . . . . . . . . . . . . . . . . . . . . . . . . . . . 3.60 4.56 (96)
Nonperforming loan rate . . . . . . . . . . . . . . . . . . . . . . . . . . . 0.86 1.10 (24)
Allowance for loan and lease losses . . . . . . . . . . . . . . . . . . . $ 326 $ 378 (14)%
Allowance coverage ratio
(5)
. . . . . . . . . . . . . . . . . . . . . . . . . 3.99% 4.70% (71) bps
(1) Period-end loans held for investment and average loans held for investment include accrued finance charges and fees, net of the estimated
uncollectible amount.
(2) Calculated by dividing interest income for the period by average loans held for investment during the period. Interest income excludes
various allocations including funds transfer pricing that assigns certain balance sheet assets, deposits and other liabilities and their related
revenue and expenses attributable to each business segment.
(3) Calculated by dividing total net revenue for the period by average loans held for investment during the period.
(4) Consists of international card purchase transactions, net of returns for the period. Excludes cash advance and balance transfer transactions.
(5) Calculated by dividing the allowance for loan and lease losses as of the end of the period by period-end loans held for investment.
Our International Card business generated net income from continuing operations of $240 million in 2014, compared
to net income from continuing operations of $234 million in 2013. The increase was primarily due to a lower
provision for credit losses, attributable to lower net charge-offs resulting from credit improvement, partially offset
by lower non-interest income due to a decrease in service charges and other customer-related fees.
Our International Card business generated net income from continuing operations of $234 million in 2013, compared
to net income from continuing operations of $126 million in 2012. The primary drivers of the improvement in results
for our International Card business in 2013, compared to 2012, included: (i) the absence of charges recorded in the
second quarter of 2012 associated with refunds to U.K. customers due to retrospective regulatory requirements
63 Capital One Financial Corporation (COF)