Capital One 2014 Annual Report Download - page 254
Download and view the complete annual report
Please find page 254 of the 2014 Capital One annual report below. You can navigate through the pages in the report by either clicking on the pages listed below, or by using the keyword search tool below to find specific information within the annual report.-
 1
1 -
2
-
3
-
4
-
5
-
6
-
7
-
8
-
9
-
10
-
11
-
12
-
13
-
14
-
15
-
16
-
17
-
18
-
19
-
20
-
21
-
22
-
23
-
24
-
25
-
26
-
27
-
28
-
29
-
30
-
31
-
32
-
33
-
34
-
35
-
36
-
37
-
38
-
39
-
40
-
41
-
42
-
43
-
44
-
45
-
46
-
47
-
48
-
49
-
50
-
51
-
52
-
53
-
54
-
55
-
56
-
57
-
58
-
59
-
60
-
61
-
62
-
63
-
64
-
65
-
66
-
67
-
68
-
69
-
70
-
71
-
72
-
73
-
74
-
75
-
76
-
77
-
78
-
79
-
80
-
81
-
82
-
83
-
84
-
85
-
86
-
87
-
88
-
89
-
90
-
91
-
92
-
93
-
94
-
95
-
96
-
97
-
98
-
99
-
100
-
101
-
102
-
103
-
104
-
105
-
106
-
107
-
108
-
109
-
110
-
111
-
112
-
113
-
114
-
115
-
116
-
117
-
118
-
119
-
120
-
121
-
122
-
123
-
124
-
125
-
126
-
127
-
128
-
129
-
130
-
131
-
132
-
133
-
134
-
135
-
136
-
137
-
138
-
139
-
140
-
141
-
142
-
143
-
144
-
145
-
146
-
147
-
148
-
149
-
150
-
151
-
152
-
153
-
154
-
155
-
156
-
157
-
158
-
159
-
160
-
161
-
162
-
163
-
164
-
165
-
166
-
167
-
168
-
169
-
170
-
171
-
172
-
173
-
174
-
175
-
176
-
177
-
178
-
179
-
180
-
181
-
182
-
183
-
184
-
185
-
186
-
187
-
188
-
189
-
190
-
191
-
192
-
193
-
194
-
195
-
196
-
197
-
198
-
199
-
200
-
201
-
202
-
203
-
204
-
205
-
206
-
207
-
208
-
209
-
210
-
211
-
212
-
213
-
214
-
215
-
216
-
217
-
218
-
219
-
220
-
221
-
222
-
223
-
224
-
225
-
226
-
227
-
228
-
229
-
230
-
231
-
232
-
233
-
234
-
235
-
236
-
237
-
238
-
239
-
240
-
241
-
242
-
243
-
 244
244 -
 245
245 -
 246
246 -
 247
247 -
 248
248 -
 249
249 -
 250
250 -
 251
251 -
 252
252 -
 253
253 -
 254
254 -
 255
255 -
 256
256 -
 257
257 -
 258
258 -
 259
259 -
 260
260 -
 261
261 -
 262
262 -
 263
263 -
 264
264 -
265
-
266
-
267
-
268
-
269
-
270
-
271
-
272
-
273
-
274
-
275
-
276
-
277
-
278
-
279
-
280
-
281
-
282
-
283
-
284
-
285
-
286
-
287
-
288
-
289
-
290
-
291
-
292
-
293
-
294
-
295
-
296
-
297
-
298
-
299
-
300
 |
 |

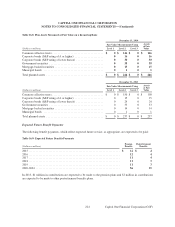
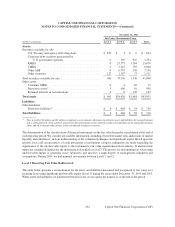
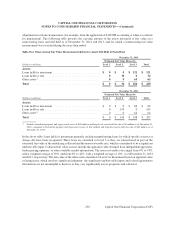
December 31, 2013
Fair Value Measurements Using
(Dollars in millions) Level 1 Level 2 Level 3 Total
Assets:
Securities available for sale:
U.S. Treasury and agency debt obligations . . . . . . . . . . . . . . . . . $ 833 $ 1 $ 0 $ 834
Corporate debt securities guaranteed by
U.S. government agencies . . . . . . . . . . . . . . . . . . . . . . . . . . 0 307 927 1,234
RMBS . . . . . . . . . . . . . . . . . . . . . . . . . . . . . . . . . . . . . . . . . . . . . 0 23,775 1,304 25,079
CMBS . . . . . . . . . . . . . . . . . . . . . . . . . . . . . . . . . . . . . . . . . . . . . 0 5,267 739 6,006
Other ABS . . . . . . . . . . . . . . . . . . . . . . . . . . . . . . . . . . . . . . . . . . 0 6,793 343 7,136
Other securities . . . . . . . . . . . . . . . . . . . . . . . . . . . . . . . . . . . . . . 127 1,367 17 1,511
Total securities available for sale . . . . . . . . . . . . . . . . . . . . . . . . . . . . 960 37,510 3,330 41,800
Other assets:
Consumer MSRs . . . . . . . . . . . . . . . . . . . . . . . . . . . . . . . . . . . . . 0 4 69 73
Derivative assets(1) . . . . . . . . . . . . . . . . . . . . . . . . . . . . . . . . . . . . 3 906 50 959
Retained interests in securitizations . . . . . . . . . . . . . . . . . . . . . . 0 0 199 199
Total assets . . . . . . . . . . . . . . . . . . . . . . . . . . . . . . . . . . . . . . . . . . . . . $ 963 $38,420 $3,648 $43,031
Liabilities:
Other liabilities:
Derivative liabilities(1) . . . . . . . . . . . . . . . . . . . . . . . . . . . . . . . . . $ 4 $ 668 $ 38 $ 710
Total liabilities . . . . . . . . . . . . . . . . . . . . . . . . . . . . . . . . . . . . . . . . . . $ 4 $ 668 $ 38 $ 710
(1) Does not reflect $4 million and $1 million recognized as a net valuation allowance on derivative assets and liabilities for non-performance
risk as of December 31, 2014 and 2013, respectively. Non-performance risk is reflected in other assets/liabilities on the consolidated balance
sheets and offset through other income in the consolidated statements of income.
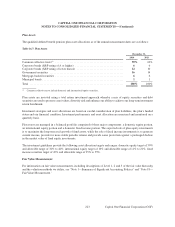
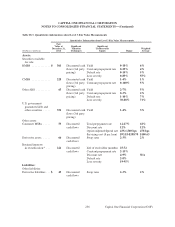
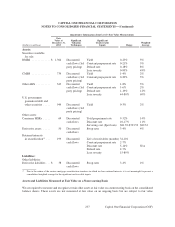
The determination of the classification of financial instruments in the fair value hierarchy is performed at the end of
each reporting period. We consider all available information, including observable market data, indications of market
liquidity and orderliness, and our understanding of the valuation techniques and significant inputs. Based upon the
specific facts and circumstances of each instrument or instrument category, judgments are made regarding the
significance of the unobservable inputs to the instruments’ fair value measurement in its entirety. If unobservable
inputs are considered significant, the instrument is classified as Level 3. The process for determining fair value using
unobservable inputs is generally more subjective and involves a high degree of management judgment and
assumptions. During 2014, we had minimal movements between Levels 1 and 2.
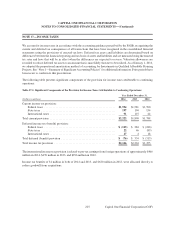
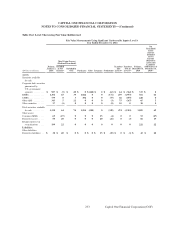
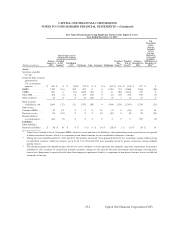
Level 3 Recurring Fair Value Rollforward
The table below presents a reconciliation for all assets and liabilities measured and recognized at fair value on a
recurring basis using significant unobservable inputs (Level 3) during the years ended December 31, 2014 and 2013.
When assets and liabilities are transferred between levels, we recognize the transfer as of the end of the period.
232
CAPITAL ONE FINANCIAL CORPORATION
NOTES TO CONSOLIDATED FINANCIAL STATEMENTS—(Continued)
Capital One Financial Corporation (COF)