Capital One 2014 Annual Report Download - page 184
Download and view the complete annual report
Please find page 184 of the 2014 Capital One annual report below. You can navigate through the pages in the report by either clicking on the pages listed below, or by using the keyword search tool below to find specific information within the annual report.-
 1
1 -
2
-
3
-
4
-
5
-
6
-
7
-
8
-
9
-
10
-
11
-
12
-
13
-
14
-
15
-
16
-
17
-
18
-
19
-
20
-
21
-
22
-
23
-
24
-
25
-
26
-
27
-
28
-
29
-
30
-
31
-
32
-
33
-
34
-
35
-
36
-
37
-
38
-
39
-
40
-
41
-
42
-
43
-
44
-
45
-
46
-
47
-
48
-
49
-
50
-
51
-
52
-
53
-
54
-
55
-
56
-
57
-
58
-
59
-
60
-
61
-
62
-
63
-
64
-
65
-
66
-
67
-
68
-
69
-
70
-
71
-
72
-
73
-
74
-
75
-
76
-
77
-
78
-
79
-
80
-
81
-
82
-
83
-
84
-
85
-
86
-
87
-
88
-
89
-
90
-
91
-
92
-
93
-
94
-
95
-
96
-
97
-
98
-
99
-
100
-
101
-
102
-
103
-
104
-
105
-
106
-
107
-
108
-
109
-
110
-
111
-
112
-
113
-
114
-
115
-
116
-
117
-
118
-
119
-
120
-
121
-
122
-
123
-
124
-
125
-
126
-
127
-
128
-
129
-
130
-
131
-
132
-
133
-
134
-
135
-
136
-
137
-
138
-
139
-
140
-
141
-
142
-
143
-
144
-
145
-
146
-
147
-
148
-
149
-
150
-
151
-
152
-
153
-
154
-
155
-
156
-
157
-
158
-
159
-
160
-
161
-
162
-
163
-
164
-
165
-
166
-
167
-
168
-
169
-
170
-
171
-
172
-
173
-
 174
174 -
 175
175 -
 176
176 -
 177
177 -
 178
178 -
 179
179 -
 180
180 -
 181
181 -
 182
182 -
 183
183 -
 184
184 -
 185
185 -
 186
186 -
 187
187 -
 188
188 -
 189
189 -
 190
190 -
 191
191 -
 192
192 -
 193
193 -
 194
194 -
195
-
196
-
197
-
198
-
199
-
200
-
201
-
202
-
203
-
204
-
205
-
206
-
207
-
208
-
209
-
210
-
211
-
212
-
213
-
214
-
215
-
216
-
217
-
218
-
219
-
220
-
221
-
222
-
223
-
224
-
225
-
226
-
227
-
228
-
229
-
230
-
231
-
232
-
233
-
234
-
235
-
236
-
237
-
238
-
239
-
240
-
241
-
242
-
243
-
244
-
245
-
246
-
247
-
248
-
249
-
250
-
251
-
252
-
253
-
254
-
255
-
256
-
257
-
258
-
259
-
260
-
261
-
262
-
263
-
264
-
265
-
266
-
267
-
268
-
269
-
270
-
271
-
272
-
273
-
274
-
275
-
276
-
277
-
278
-
279
-
280
-
281
-
282
-
283
-
284
-
285
-
286
-
287
-
288
-
289
-
290
-
291
-
292
-
293
-
294
-
295
-
296
-
297
-
298
-
299
-
300
 |
 |
162
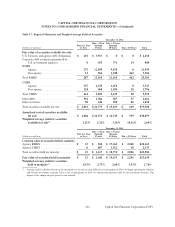
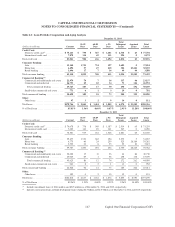
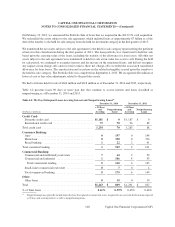
Table 3.7: Expected Maturities and Weighted Average Yields of Securities
December 31, 2014
Due > 1 Year Due > 5 Years
Due in 1 Year through through
(Dollars in millions) or Less 5 Years 10 Years Due > 10 Years Total
Fair value of securities available for sale:
U.S. Treasury and agency debt obligations . . $ 201 $ 3,917 $ 0 $ 0 $ 4,118
Corporate debt securities guaranteed by
U.S. government agencies . . . . . . . . . . . 0 415 371 14 800
RMBS:
Agency . . . . . . . . . . . . . . . . . . . . . . . . . 275 12,050 9,670 0 21,995
Non-agency . . . . . . . . . . . . . . . . . . . . . . 12 964 1,948 462 3,386
Total RMBS . . . . . . . . . . . . . . . . . . . . . . . . . 287 13,014 11,618 462 25,381
CMBS:
Agency . . . . . . . . . . . . . . . . . . . . . . . . . 337 2,335 1,051 0 3,723
Non-agency . . . . . . . . . . . . . . . . . . . . . . 124 468 1,184 20 1,796
Total CMBS . . . . . . . . . . . . . . . . . . . . . . . . . 461 2,803 2,235 20 5,519
Other ABS . . . . . . . . . . . . . . . . . . . . . . . . . . . 954 1,386 287 35 2,662
Other securities . . . . . . . . . . . . . . . . . . . . . . . 98 244 598 88 1,028
Total securities available for sale . . . . . . . . . $ 2,001 $ 21,779 $ 15,109 $ 619 $39,508
Amortized cost of securities available
for sale . . . . . . . . . . . . . . . . . . . . . . . . . $ 2,004 $ 21,571 $ 14,745 $ 539 $38,859
Weighted average yield for securities
available for sale(1) . . . . . . . . . . . . . . . . 1.23% 2.21% 3.20% 10.61% 2.64%
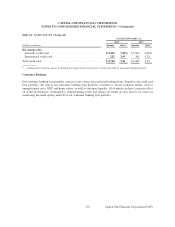
December 31, 2014
Due > 1 Year Due > 5 Years
Due in 1 Year through through
(Dollars in millions) or Less 5 Years 10 Years Due > 10 Years Total
Carrying value of securities held to maturity:
Agency RMBS . . . . . . . . . . . . . . . . . . . . . . . $ 23 $ 810 $ 17,262 $ 2,068 $20,163
Agency CMBS . . . . . . . . . . . . . . . . . . . . . . . 0 807 1,512 18 2,337
Total securities held for maturity . . . . . . . . . $ 23 $ 1,617 $ 18,774 $ 2,086 $22,500
Fair value of securities held to maturity . . $ 23 $ 1,642 $ 19,673 $ 2,296 $23,634
Weighted average yield for securities
held to maturity(1) . . . . . . . . . . . . . . . . 4.13% 2.73% 2.68% 3.53% 2.76%
(1) Average yield is calculated based on the amortized cost of each security. Effective second quarter of 2014, we began reporting the effective
yield for the investment securities. Prior to the second quarter of 2014, we reported the purchase yield for the investment securities. The
impact of this change on prior periods is not material.
CAPITAL ONE FINANCIAL CORPORATION
NOTES TO CONSOLIDATED FINANCIAL STATEMENTS—(Continued)
Capital One Financial Corporation (COF)