Capital One 2014 Annual Report Download - page 82
Download and view the complete annual report
Please find page 82 of the 2014 Capital One annual report below. You can navigate through the pages in the report by either clicking on the pages listed below, or by using the keyword search tool below to find specific information within the annual report.-
 1
1 -
2
-
3
-
4
-
5
-
6
-
7
-
8
-
9
-
10
-
11
-
12
-
13
-
14
-
15
-
16
-
17
-
18
-
19
-
20
-
21
-
22
-
23
-
24
-
25
-
26
-
27
-
28
-
29
-
30
-
31
-
32
-
33
-
34
-
35
-
36
-
37
-
38
-
39
-
40
-
41
-
42
-
43
-
44
-
45
-
46
-
47
-
48
-
49
-
50
-
51
-
52
-
53
-
54
-
55
-
56
-
57
-
58
-
59
-
60
-
61
-
62
-
63
-
64
-
65
-
66
-
67
-
68
-
69
-
70
-
71
-
 72
72 -
 73
73 -
 74
74 -
 75
75 -
 76
76 -
 77
77 -
 78
78 -
 79
79 -
 80
80 -
 81
81 -
 82
82 -
 83
83 -
 84
84 -
 85
85 -
 86
86 -
 87
87 -
 88
88 -
 89
89 -
 90
90 -
 91
91 -
 92
92 -
93
-
94
-
95
-
96
-
97
-
98
-
99
-
100
-
101
-
102
-
103
-
104
-
105
-
106
-
107
-
108
-
109
-
110
-
111
-
112
-
113
-
114
-
115
-
116
-
117
-
118
-
119
-
120
-
121
-
122
-
123
-
124
-
125
-
126
-
127
-
128
-
129
-
130
-
131
-
132
-
133
-
134
-
135
-
136
-
137
-
138
-
139
-
140
-
141
-
142
-
143
-
144
-
145
-
146
-
147
-
148
-
149
-
150
-
151
-
152
-
153
-
154
-
155
-
156
-
157
-
158
-
159
-
160
-
161
-
162
-
163
-
164
-
165
-
166
-
167
-
168
-
169
-
170
-
171
-
172
-
173
-
174
-
175
-
176
-
177
-
178
-
179
-
180
-
181
-
182
-
183
-
184
-
185
-
186
-
187
-
188
-
189
-
190
-
191
-
192
-
193
-
194
-
195
-
196
-
197
-
198
-
199
-
200
-
201
-
202
-
203
-
204
-
205
-
206
-
207
-
208
-
209
-
210
-
211
-
212
-
213
-
214
-
215
-
216
-
217
-
218
-
219
-
220
-
221
-
222
-
223
-
224
-
225
-
226
-
227
-
228
-
229
-
230
-
231
-
232
-
233
-
234
-
235
-
236
-
237
-
238
-
239
-
240
-
241
-
242
-
243
-
244
-
245
-
246
-
247
-
248
-
249
-
250
-
251
-
252
-
253
-
254
-
255
-
256
-
257
-
258
-
259
-
260
-
261
-
262
-
263
-
264
-
265
-
266
-
267
-
268
-
269
-
270
-
271
-
272
-
273
-
274
-
275
-
276
-
277
-
278
-
279
-
280
-
281
-
282
-
283
-
284
-
285
-
286
-
287
-
288
-
289
-
290
-
291
-
292
-
293
-
294
-
295
-
296
-
297
-
298
-
299
-
300
 |
 |
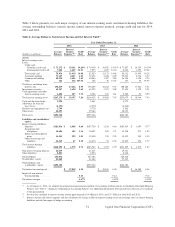
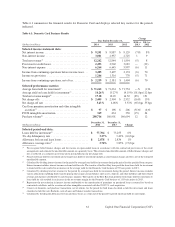
driven by the absence of the provision for credit losses of $1.2 billion recorded in the second quarter of 2012
to establish an allowance for credit card loans acquired in the 2012 U.S. card acquisition.
•Non-Interest Expense: Non-interest expense increased by $585 million, or 9%, to $7.4 billion in 2013, compared
to $6.9 billion in 2012. The increase was largely due to higher operating expenses resulting from the 2012 U.S.
card acquisition. This includes PCCR intangible amortization expense of $434 million in 2013, compared to
$350 million in 2012.
•Loans Held for Investment: Period-end loans held for investment in our Credit Card business decreased by
$10.5 billion, or 11%, to $81.3 billion as of December 31, 2013, from $91.8 billion as of December 31, 2012,
and average loans held for investment decreased by $802 million, or 1%, to $79.2 billion in 2013, compared to
$80.0 billion in 2012. The decreases were due in part to the Portfolio Sale in 2013, as well as the expected
continued run-off of our installment loan portfolio and certain other credit card loans acquired in the 2012 U.S.
card acquisition, partially offset by growth in certain other credit card segments.
•Net Charge-off and Delinquency Statistics: Our net charge-off rate increased to 4.15% in 2013, compared to
3.68% in 2012. The 30+ day delinquency rate decreased to 3.54% as of December 31, 2013, compared to 3.69%
as of December 31, 2012. The increase in net charge-off rates in 2013 were largely due to the impact of charge-
offs from the 2012 U.S. card acquisition which was recorded at fair value.
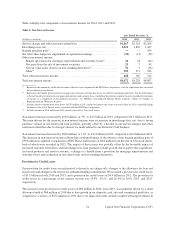
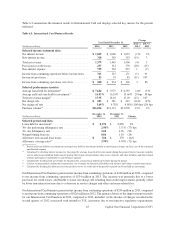
Domestic Card Business
Domestic Card generated net income from continuing operations of $2.2 billion, $2.4 billion and $1.4 billion in
2014, 2013 and 2012, respectively. Domestic Card accounted for 90% of total net revenues for our Credit Card
business in 2014, compared to 90% and 89% in 2013 and 2012, respectively, for our Credit Card business. Income
attributable to Domestic Card represented 90% of net income for our Credit Card business in 2014, compared to
91% and 92% in 2013 and 2012, respectively.
60 Capital One Financial Corporation (COF)