Capital One 2014 Annual Report Download - page 128
Download and view the complete annual report
Please find page 128 of the 2014 Capital One annual report below. You can navigate through the pages in the report by either clicking on the pages listed below, or by using the keyword search tool below to find specific information within the annual report.-
 1
1 -
2
-
3
-
4
-
5
-
6
-
7
-
8
-
9
-
10
-
11
-
12
-
13
-
14
-
15
-
16
-
17
-
18
-
19
-
20
-
21
-
22
-
23
-
24
-
25
-
26
-
27
-
28
-
29
-
30
-
31
-
32
-
33
-
34
-
35
-
36
-
37
-
38
-
39
-
40
-
41
-
42
-
43
-
44
-
45
-
46
-
47
-
48
-
49
-
50
-
51
-
52
-
53
-
54
-
55
-
56
-
57
-
58
-
59
-
60
-
61
-
62
-
63
-
64
-
65
-
66
-
67
-
68
-
69
-
70
-
71
-
72
-
73
-
74
-
75
-
76
-
77
-
78
-
79
-
80
-
81
-
82
-
83
-
84
-
85
-
86
-
87
-
88
-
89
-
90
-
91
-
92
-
93
-
94
-
95
-
96
-
97
-
98
-
99
-
100
-
101
-
102
-
103
-
104
-
105
-
106
-
107
-
108
-
109
-
110
-
111
-
112
-
113
-
114
-
115
-
116
-
117
-
 118
118 -
 119
119 -
 120
120 -
 121
121 -
 122
122 -
 123
123 -
 124
124 -
 125
125 -
 126
126 -
 127
127 -
 128
128 -
 129
129 -
 130
130 -
 131
131 -
 132
132 -
 133
133 -
 134
134 -
 135
135 -
 136
136 -
 137
137 -
 138
138 -
139
-
140
-
141
-
142
-
143
-
144
-
145
-
146
-
147
-
148
-
149
-
150
-
151
-
152
-
153
-
154
-
155
-
156
-
157
-
158
-
159
-
160
-
161
-
162
-
163
-
164
-
165
-
166
-
167
-
168
-
169
-
170
-
171
-
172
-
173
-
174
-
175
-
176
-
177
-
178
-
179
-
180
-
181
-
182
-
183
-
184
-
185
-
186
-
187
-
188
-
189
-
190
-
191
-
192
-
193
-
194
-
195
-
196
-
197
-
198
-
199
-
200
-
201
-
202
-
203
-
204
-
205
-
206
-
207
-
208
-
209
-
210
-
211
-
212
-
213
-
214
-
215
-
216
-
217
-
218
-
219
-
220
-
221
-
222
-
223
-
224
-
225
-
226
-
227
-
228
-
229
-
230
-
231
-
232
-
233
-
234
-
235
-
236
-
237
-
238
-
239
-
240
-
241
-
242
-
243
-
244
-
245
-
246
-
247
-
248
-
249
-
250
-
251
-
252
-
253
-
254
-
255
-
256
-
257
-
258
-
259
-
260
-
261
-
262
-
263
-
264
-
265
-
266
-
267
-
268
-
269
-
270
-
271
-
272
-
273
-
274
-
275
-
276
-
277
-
278
-
279
-
280
-
281
-
282
-
283
-
284
-
285
-
286
-
287
-
288
-
289
-
290
-
291
-
292
-
293
-
294
-
295
-
296
-
297
-
298
-
299
-
300
 |
 |

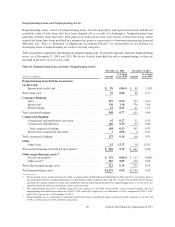
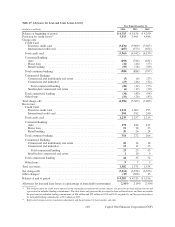
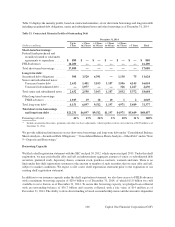
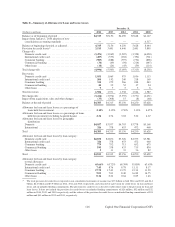
Table 33 displays the maturity profile, based on contractual maturities, of our short-term borrowings and long-term debt
including securitized debt obligations, senior and subordinated notes and other borrowings as of December 31, 2014.
Table 33: Contractual Maturity Profile of Outstanding Debt
December 31, 2014
Up to > 1 Year > 2 Years > 3 Years > 4 Years
(Dollars in millions) 1 Year to 2 Years to 3 Years to 4 Years to 5 Years > 5 Years Total
Short-term borrowings:
Federal funds purchased and
securities loaned or sold under
agreements to repurchase . . . . . . . .$ 880 $ — $ — $ — $ — $ — $ 880
FHLB advances . . . . . . . . . . . . . . . . 16,200 — — — — — 16,200
Total short-term borrowings . . . . . . . 17,080 — — — — — 17,080
Long-term debt:
Securitized debt obligations . . . . . . . 500 3,520 6,391 — 1,138 75 11,624
Senior and subordinated notes:
Unsecured senior debt . . . . . . . . . 2,632 1,481 3,103 1,187 3,506 4,145 16,054
Unsecured subordinated debt . . . . — 1,077 — — 326 1,227 2,630
Total senior and subordinated notes . . 2,632 2,558 3,103 1,187 3,832 5,372 18,684
Other long-term borrowings:
FHLB advances . . . . . . . . . . . . . . 1,019 19 18 10 1 2 1,069
Total long-term debt(1) . . . . . . . . . . . . 4,151 6,097 9,512 1,197 4,971 5,449 31,377
Total short-term borrowings
and long-term debt . . . . . . . . . . . $21,231 $6,097 $9,512 $1,197 $4,971 $5,449 $48,457
Percentage of total . . . . . . . . . . . . . . 44% 13% 20% 2% 10% 11% 100%
(1) Includes unamortized discounts, premiums and other cost basis adjustments, which together result in a net reduction of $233 million as of
December 31, 2014.
We provide additional information on our short-term borrowings and long-term debt under “Consolidated Balance
Sheets Analysis—Securitized Debt Obligations,” “Consolidated Balance Sheets Analysis—Other Debt” and in “Note
9—Deposits and Borrowings.”
Borrowing Capacity
We filed a shelf registration statement with the SEC on April 30, 2012, which expires in April 2015. Under this shelf
registration, we may periodically offer and sell an indeterminate aggregate amount of senior or subordinated debt
securities, preferred stock, depositary shares, common stock, purchase contracts, warrants and units. There is no
limit under this shelf registration statement to the amount or number of such securities that we may offer and sell,
subject to market conditions. We expect to file a new shelf registration statement prior to the expiration of our
existing shelf registration statement.
In addition to our issuance capacity under the shelf registration statement, we also have access to FHLB advances
with a maximum borrowing capacity of $29.6 billion as of December 31, 2014, of which $11.8 billion was still
available to us to borrow as of December 31, 2014. To secure this borrowing capacity, we pledged loan collateral
with an outstanding balance of $36.7 billion and security collateral with a fair value of $14 million as of
December 31, 2014. The ability to draw down funding is based on membership status and the amount is dependent
106 Capital One Financial Corporation (COF)