Capital One 2014 Annual Report Download - page 191
Download and view the complete annual report
Please find page 191 of the 2014 Capital One annual report below. You can navigate through the pages in the report by either clicking on the pages listed below, or by using the keyword search tool below to find specific information within the annual report.-
 1
1 -
2
-
3
-
4
-
5
-
6
-
7
-
8
-
9
-
10
-
11
-
12
-
13
-
14
-
15
-
16
-
17
-
18
-
19
-
20
-
21
-
22
-
23
-
24
-
25
-
26
-
27
-
28
-
29
-
30
-
31
-
32
-
33
-
34
-
35
-
36
-
37
-
38
-
39
-
40
-
41
-
42
-
43
-
44
-
45
-
46
-
47
-
48
-
49
-
50
-
51
-
52
-
53
-
54
-
55
-
56
-
57
-
58
-
59
-
60
-
61
-
62
-
63
-
64
-
65
-
66
-
67
-
68
-
69
-
70
-
71
-
72
-
73
-
74
-
75
-
76
-
77
-
78
-
79
-
80
-
81
-
82
-
83
-
84
-
85
-
86
-
87
-
88
-
89
-
90
-
91
-
92
-
93
-
94
-
95
-
96
-
97
-
98
-
99
-
100
-
101
-
102
-
103
-
104
-
105
-
106
-
107
-
108
-
109
-
110
-
111
-
112
-
113
-
114
-
115
-
116
-
117
-
118
-
119
-
120
-
121
-
122
-
123
-
124
-
125
-
126
-
127
-
128
-
129
-
130
-
131
-
132
-
133
-
134
-
135
-
136
-
137
-
138
-
139
-
140
-
141
-
142
-
143
-
144
-
145
-
146
-
147
-
148
-
149
-
150
-
151
-
152
-
153
-
154
-
155
-
156
-
157
-
158
-
159
-
160
-
161
-
162
-
163
-
164
-
165
-
166
-
167
-
168
-
169
-
170
-
171
-
172
-
173
-
174
-
175
-
176
-
177
-
178
-
179
-
180
-
 181
181 -
 182
182 -
 183
183 -
 184
184 -
 185
185 -
 186
186 -
 187
187 -
 188
188 -
 189
189 -
 190
190 -
 191
191 -
 192
192 -
 193
193 -
 194
194 -
 195
195 -
 196
196 -
 197
197 -
 198
198 -
 199
199 -
 200
200 -
 201
201 -
202
-
203
-
204
-
205
-
206
-
207
-
208
-
209
-
210
-
211
-
212
-
213
-
214
-
215
-
216
-
217
-
218
-
219
-
220
-
221
-
222
-
223
-
224
-
225
-
226
-
227
-
228
-
229
-
230
-
231
-
232
-
233
-
234
-
235
-
236
-
237
-
238
-
239
-
240
-
241
-
242
-
243
-
244
-
245
-
246
-
247
-
248
-
249
-
250
-
251
-
252
-
253
-
254
-
255
-
256
-
257
-
258
-
259
-
260
-
261
-
262
-
263
-
264
-
265
-
266
-
267
-
268
-
269
-
270
-
271
-
272
-
273
-
274
-
275
-
276
-
277
-
278
-
279
-
280
-
281
-
282
-
283
-
284
-
285
-
286
-
287
-
288
-
289
-
290
-
291
-
292
-
293
-
294
-
295
-
296
-
297
-
298
-
299
-
300
 |
 |

169
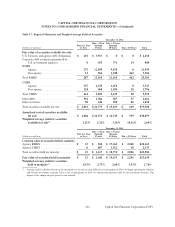
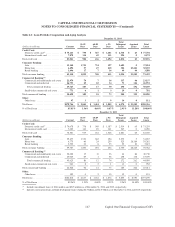
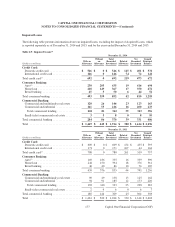
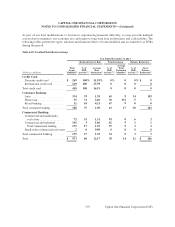
Credit Card
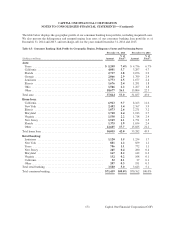
Our credit card loan portfolio is generally highly diversified across millions of accounts and numerous geographies
without significant individual exposure. We therefore generally manage credit risk on a portfolio basis. The risk in
our credit card portfolio correlates to broad economic trends, such as unemployment rates, gross domestic product
(“GDP”), and home values, as well as customer liquidity, which can have a material effect on credit performance.
The primary factors we assess in monitoring the credit quality and risk of our credit card portfolio are delinquency
and charge-off trends, including an analysis of the migration of loans between delinquency categories over time.
The table below displays the geographic profile of our credit card loan portfolio and delinquency statistics as of
December 31, 2014 and 2013. We also present the delinquency rates of our credit card loan portfolio, including
Acquired Loans, and comparative net charge-offs for the years ended December 31, 2014 and 2013.
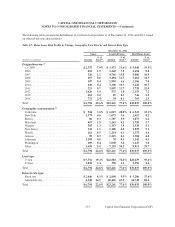
Table 4.3: Credit Card: Risk Profile by Geographic Region and Delinquency Status
December 31, 2014 December 31, 2013
% of % of
(Dollars in millions) Amount Total(1) Amount Total(1)
Domestic credit card:
California . . . . . . . . . . . . . . . . . . . . . . . . . . . . . . . . . . . . . . . . . . . . . $ 8,574 10.0% $ 7,940 9.8%
New York . . . . . . . . . . . . . . . . . . . . . . . . . . . . . . . . . . . . . . . . . . . . . 5,610 6.5 5,277 6.5
Texas . . . . . . . . . . . . . . . . . . . . . . . . . . . . . . . . . . . . . . . . . . . . . . . . 5,382 6.3 4,993 6.1
Florida . . . . . . . . . . . . . . . . . . . . . . . . . . . . . . . . . . . . . . . . . . . . . . . 4,794 5.6 4,325 5.3
Illinois . . . . . . . . . . . . . . . . . . . . . . . . . . . . . . . . . . . . . . . . . . . . . . . 3,747 4.4 3,603 4.4
Pennsylvania . . . . . . . . . . . . . . . . . . . . . . . . . . . . . . . . . . . . . . . . . . 3,581 4.2 3,442 4.2
Ohio . . . . . . . . . . . . . . . . . . . . . . . . . . . . . . . . . . . . . . . . . . . . . . . . . 3,075 3.6 2,965 3.6
New Jersey . . . . . . . . . . . . . . . . . . . . . . . . . . . . . . . . . . . . . . . . . . . . 2,868 3.3 2,736 3.4
Michigan . . . . . . . . . . . . . . . . . . . . . . . . . . . . . . . . . . . . . . . . . . . . . 2,681 3.1 2,595 3.2
Other . . . . . . . . . . . . . . . . . . . . . . . . . . . . . . . . . . . . . . . . . . . . . . . . . 37,392 43.5 35,379 43.6
Total domestic credit card . . . . . . . . . . . . . . . . . . . . . . . . . . . . . . . . . . 77,704 90.5 73,255 90.1
International credit card:
Canada . . . . . . . . . . . . . . . . . . . . . . . . . . . . . . . . . . . . . . . . . . . . . . . 4,747 5.5 4,503 5.5
United Kingdom . . . . . . . . . . . . . . . . . . . . . . . . . . . . . . . . . . . . . . . . 3,425 4.0 3,547 4.4
Total international credit card . . . . . . . . . . . . . . . . . . . . . . . . . . . . . . . 8,172 9.5 8,050 9.9
Total credit card . . . . . . . . . . . . . . . . . . . . . . . . . . . . . . . . . . . . . . . . . . $85,876 100.0% $81,305 100.0%
December 31, 2014 December 31, 2013
% of % of
(Dollars in millions) Amount Total(2) Amount Total(2)
Selected credit metrics:
30+ day delinquencies . . . . . . . . . . . . . . . . . . . . . . . . . . . . . . . . . . . . . $ 2,832 3.30% $ 2,881 3.54%
90+ day delinquencies . . . . . . . . . . . . . . . . . . . . . . . . . . . . . . . . . . . . . 1,292 1.50 1,328 1.63
(1) Percentages by geographic region within the domestic and international credit card portfolios are calculated based on the total held for
investment credit card loans as of the end of the reported period.
(2) Calculated by dividing delinquent credit card loans by the total balance of credit card loans held for investment as of the end of the reported
period.
CAPITAL ONE FINANCIAL CORPORATION
NOTES TO CONSOLIDATED FINANCIAL STATEMENTS—(Continued)
Capital One Financial Corporation (COF)