Capital One 2014 Annual Report Download - page 95
Download and view the complete annual report
Please find page 95 of the 2014 Capital One annual report below. You can navigate through the pages in the report by either clicking on the pages listed below, or by using the keyword search tool below to find specific information within the annual report.-
 1
1 -
2
-
3
-
4
-
5
-
6
-
7
-
8
-
9
-
10
-
11
-
12
-
13
-
14
-
15
-
16
-
17
-
18
-
19
-
20
-
21
-
22
-
23
-
24
-
25
-
26
-
27
-
28
-
29
-
30
-
31
-
32
-
33
-
34
-
35
-
36
-
37
-
38
-
39
-
40
-
41
-
42
-
43
-
44
-
45
-
46
-
47
-
48
-
49
-
50
-
51
-
52
-
53
-
54
-
55
-
56
-
57
-
58
-
59
-
60
-
61
-
62
-
63
-
64
-
65
-
66
-
67
-
68
-
69
-
70
-
71
-
72
-
73
-
74
-
75
-
76
-
77
-
78
-
79
-
80
-
81
-
82
-
83
-
84
-
 85
85 -
 86
86 -
 87
87 -
 88
88 -
 89
89 -
 90
90 -
 91
91 -
 92
92 -
 93
93 -
 94
94 -
 95
95 -
 96
96 -
 97
97 -
 98
98 -
 99
99 -
 100
100 -
 101
101 -
 102
102 -
 103
103 -
 104
104 -
 105
105 -
106
-
107
-
108
-
109
-
110
-
111
-
112
-
113
-
114
-
115
-
116
-
117
-
118
-
119
-
120
-
121
-
122
-
123
-
124
-
125
-
126
-
127
-
128
-
129
-
130
-
131
-
132
-
133
-
134
-
135
-
136
-
137
-
138
-
139
-
140
-
141
-
142
-
143
-
144
-
145
-
146
-
147
-
148
-
149
-
150
-
151
-
152
-
153
-
154
-
155
-
156
-
157
-
158
-
159
-
160
-
161
-
162
-
163
-
164
-
165
-
166
-
167
-
168
-
169
-
170
-
171
-
172
-
173
-
174
-
175
-
176
-
177
-
178
-
179
-
180
-
181
-
182
-
183
-
184
-
185
-
186
-
187
-
188
-
189
-
190
-
191
-
192
-
193
-
194
-
195
-
196
-
197
-
198
-
199
-
200
-
201
-
202
-
203
-
204
-
205
-
206
-
207
-
208
-
209
-
210
-
211
-
212
-
213
-
214
-
215
-
216
-
217
-
218
-
219
-
220
-
221
-
222
-
223
-
224
-
225
-
226
-
227
-
228
-
229
-
230
-
231
-
232
-
233
-
234
-
235
-
236
-
237
-
238
-
239
-
240
-
241
-
242
-
243
-
244
-
245
-
246
-
247
-
248
-
249
-
250
-
251
-
252
-
253
-
254
-
255
-
256
-
257
-
258
-
259
-
260
-
261
-
262
-
263
-
264
-
265
-
266
-
267
-
268
-
269
-
270
-
271
-
272
-
273
-
274
-
275
-
276
-
277
-
278
-
279
-
280
-
281
-
282
-
283
-
284
-
285
-
286
-
287
-
288
-
289
-
290
-
291
-
292
-
293
-
294
-
295
-
296
-
297
-
298
-
299
-
300
 |
 |

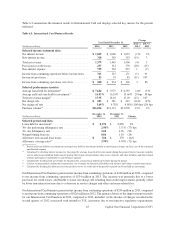
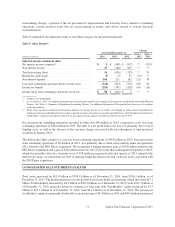
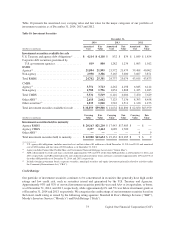
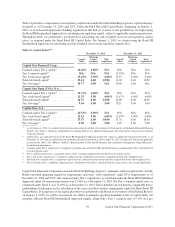
Table 10 presents the amortized cost, carrying value and fair value for the major categories of our portfolio of
investment securities as of December 31, 2014, 2013 and 2012.
Table 10: Investment Securities
December 31,
2014 2013 2012
Amortized Fair Amortized Fair Amortized Fair
(Dollars in millions) Cost Value Cost Value Cost Value
Investment securities available for sale
U.S. Treasury and agency debt obligations(1) . . . . . $ 4,114 $ 4,118 $ 832 $ 834 $ 1,849 $ 1,854
Corporate debt securities guaranteed by
U.S. government agencies . . . . . . . . . . . . . . . . . . 819 800 1,282 1,234 1,003 1,012
RMBS:
Agency(2) . . . . . . . . . . . . . . . . . . . . . . . . . . . . . . . . . 21,804 21,995 21,572 21,479 39,408 40,002
Non-agency . . . . . . . . . . . . . . . . . . . . . . . . . . . . . . . 2,938 3,386 3,165 3,600 3,607 3,871
Total RMBS . . . . . . . . . . . . . . . . . . . . . . . . . . . . . . 24,742 25,381 24,737 25,079 43,015 43,873
CMBS:
Agency(2) . . . . . . . . . . . . . . . . . . . . . . . . . . . . . . . . . 3,751 3,723 4,262 4,198 6,045 6,144
Non-agency . . . . . . . . . . . . . . . . . . . . . . . . . . . . . . . 1,780 1,796 1,854 1,808 1,425 1,485
Total CMBS . . . . . . . . . . . . . . . . . . . . . . . . . . . . . . 5,531 5,519 6,116 6,006 7,470 7,629
Other ABS(3) . . . . . . . . . . . . . . . . . . . . . . . . . . . . . . 2,618 2,662 7,123 7,136 8,393 8,458
Other securities(4) . . . . . . . . . . . . . . . . . . . . . . . . . . 1,035 1,028 1,542 1,511 1,120 1,153
Total investment securities available for sale . . . . . $ 38,859 $39,508 $ 41,632 $41,800 $ 62,850 $63,979
Carrying Fair Carrying Fair Carrying Fair
(Dollars in millions) Value Value Value Value Value Value
Investment securities held to maturity
Agency RMBS . . . . . . . . . . . . . . . . . . . . . . . . . . . . $ 20,163 $21,210 $ 17,443 $17,485 $ — $ —
Agency CMBS . . . . . . . . . . . . . . . . . . . . . . . . . . . . 2,337 2,424 1,689 1,700 — —
Other ABS(3) . . . . . . . . . . . . . . . . . . . . . . . . . . . . . . —— —— 9 9
Total investment securities held to maturity . . . . . . $ 22,500 $23,634 $ 19,132 $19,185 $ 9 $ 9
(1) U.S. agency debt obligations, includes amortized cost and fair value of $1 million as of both December 31, 2014 and 2013, and amortized
cost of $301 million and fair value of $302 million as of December 31, 2012.
(2) Agency includes Fannie Mae, Freddie Mac, and Government National Mortgage Association (“Ginnie Mae”).
(3) ABS collateralized by credit card loans constituted approximately 56% and 65% of the other ABS portfolio as of December 31, 2014, and
2013, respectively, and ABS collateralized by auto dealer floor plan inventory loans and leases constituted approximately 16% and 15% of
the other ABS portfolio as of December 31, 2014, and 2013, respectively.
(4) Includes foreign government bonds, corporate securities, municipal securities and equity investments primarily related to activities under
the Community Reinvestment Act (“CRA”).
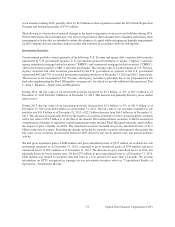
Credit Ratings
Our portfolio of investment securities continues to be concentrated in securities that generally have high credit
ratings and low credit risk, such as securities issued and guaranteed by the U.S. Treasury and Agencies.
Approximately 93% and 92% of our total investment securities portfolio was rated AA+ or its equivalent, or better,
as of December 31, 2014, and 2013, respectively, while approximately 6% and 5% was below investment grade as
of December 31, 2014 and 2013, respectively. We categorize the credit ratings of our investment securities based on
the lowest credit rating as issued by the following rating agencies: Standard & Poor’s Ratings Services (“S&P”),
Moody’s Investors Service (“Moody’s”) and Fitch Ratings (“Fitch”).
73 Capital One Financial Corporation (COF)