Capital One 2014 Annual Report Download - page 130
Download and view the complete annual report
Please find page 130 of the 2014 Capital One annual report below. You can navigate through the pages in the report by either clicking on the pages listed below, or by using the keyword search tool below to find specific information within the annual report.-
 1
1 -
2
-
3
-
4
-
5
-
6
-
7
-
8
-
9
-
10
-
11
-
12
-
13
-
14
-
15
-
16
-
17
-
18
-
19
-
20
-
21
-
22
-
23
-
24
-
25
-
26
-
27
-
28
-
29
-
30
-
31
-
32
-
33
-
34
-
35
-
36
-
37
-
38
-
39
-
40
-
41
-
42
-
43
-
44
-
45
-
46
-
47
-
48
-
49
-
50
-
51
-
52
-
53
-
54
-
55
-
56
-
57
-
58
-
59
-
60
-
61
-
62
-
63
-
64
-
65
-
66
-
67
-
68
-
69
-
70
-
71
-
72
-
73
-
74
-
75
-
76
-
77
-
78
-
79
-
80
-
81
-
82
-
83
-
84
-
85
-
86
-
87
-
88
-
89
-
90
-
91
-
92
-
93
-
94
-
95
-
96
-
97
-
98
-
99
-
100
-
101
-
102
-
103
-
104
-
105
-
106
-
107
-
108
-
109
-
110
-
111
-
112
-
113
-
114
-
115
-
116
-
117
-
118
-
119
-
 120
120 -
 121
121 -
 122
122 -
 123
123 -
 124
124 -
 125
125 -
 126
126 -
 127
127 -
 128
128 -
 129
129 -
 130
130 -
 131
131 -
 132
132 -
 133
133 -
 134
134 -
 135
135 -
 136
136 -
 137
137 -
 138
138 -
 139
139 -
 140
140 -
141
-
142
-
143
-
144
-
145
-
146
-
147
-
148
-
149
-
150
-
151
-
152
-
153
-
154
-
155
-
156
-
157
-
158
-
159
-
160
-
161
-
162
-
163
-
164
-
165
-
166
-
167
-
168
-
169
-
170
-
171
-
172
-
173
-
174
-
175
-
176
-
177
-
178
-
179
-
180
-
181
-
182
-
183
-
184
-
185
-
186
-
187
-
188
-
189
-
190
-
191
-
192
-
193
-
194
-
195
-
196
-
197
-
198
-
199
-
200
-
201
-
202
-
203
-
204
-
205
-
206
-
207
-
208
-
209
-
210
-
211
-
212
-
213
-
214
-
215
-
216
-
217
-
218
-
219
-
220
-
221
-
222
-
223
-
224
-
225
-
226
-
227
-
228
-
229
-
230
-
231
-
232
-
233
-
234
-
235
-
236
-
237
-
238
-
239
-
240
-
241
-
242
-
243
-
244
-
245
-
246
-
247
-
248
-
249
-
250
-
251
-
252
-
253
-
254
-
255
-
256
-
257
-
258
-
259
-
260
-
261
-
262
-
263
-
264
-
265
-
266
-
267
-
268
-
269
-
270
-
271
-
272
-
273
-
274
-
275
-
276
-
277
-
278
-
279
-
280
-
281
-
282
-
283
-
284
-
285
-
286
-
287
-
288
-
289
-
290
-
291
-
292
-
293
-
294
-
295
-
296
-
297
-
298
-
299
-
300
 |
 |

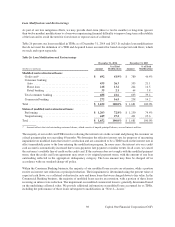
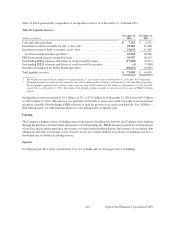
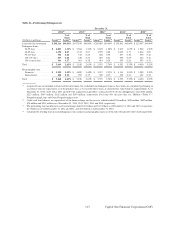
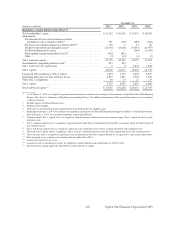
Table 35: Contractual Obligations
December 31, 2014
Up to > 1 Years > 3 Years
(Dollars in millions) 1 Year to 3 Years to 5 Years > 5 Years Total
Interest-bearing time deposits(1) . . . . . . . . . . . . . . . . . . . . . $ 6,215 $ 1,834 $ 1,115 $ 125 $ 9,289
Securitized debt obligations . . . . . . . . . . . . . . . . . . . . . . . 500 9,911 1,138 75 11,624
Other debt:
Federal funds purchased and securities loaned
or sold under agreements to repurchase . . . . . . . . . . . . 880 — — — 880
Senior and subordinated notes . . . . . . . . . . . . . . . . . . . . 2,632 5,661 5,019 5,372 18,684
Other borrowings(2) . . . . . . . . . . . . . . . . . . . . . . . . . . . . 17,219 37 11 2 17,269
Total other debt . . . . . . . . . . . . . . . . . . . . . . . . . . . . . . . . . 20,731 5,698 5,030 5,374 36,833
Operating leases . . . . . . . . . . . . . . . . . . . . . . . . . . . . . . . . 256 497 427 1,071 2,251
Purchase obligations(3) . . . . . . . . . . . . . . . . . . . . . . . . . . . . 258 280 168 — 706
Total . . . . . . . . . . . . . . . . . . . . . . . . . . . . . . . . . . . . . . . . . . $27,960 $18,220 $ 7,878 $ 6,645 $60,703
(1) Includes only those interest-bearing deposits which have a contractual maturity date.
(2) Other borrowings include FHLB advances.
(3) Represents agreements to purchase goods or services that are enforceable and legally binding and specify all significant terms. The purchase
obligations are included through the termination date of the agreements even if the contract is renewable. These include capital expenditures,
contractual commitments to purchase equipment and services, software acquisition/license commitments, contractual minimum media
commitments and any contractually required cash payments for acquisitions, and exclude funding commitments entered into in the ordinary
course of business. See “Note 20—Commitments, Contingencies, Guarantees and Others” for further details.
MARKET RISK PROFILE
Market risk is inherent in the financial instruments associated with our operations and activities, including loans,
deposits, securities, short-term borrowings, long-term debt and derivatives. Below we provide additional information
about our primary sources of market risk, our market risk management strategies and the measures we use to evaluate
our market risk exposure.
Primary Market Risk Exposures
Our primary source of market risk is interest rate risk. We also have exposure to foreign exchange risk.
Interest Rate Risk
Interest rate risk, which represents exposure to instruments whose yield or price varies with the volatility of interest
rates, is our most significant source of market risk exposure. Banks are inevitably exposed to interest rate risk due
to differences in the timing between the maturities or repricing of assets and liabilities.
Foreign Exchange Risk
Foreign exchange risk represents exposure to changes in the values of current holdings and future cash flows
denominated in other currencies. Our primary exposure is related to the funding of and non-dollar net
investments in our International Card business in the U.K and Canada. Our intercompany funding exposes our
income statement to foreign exchange transaction risk, while our equity investments in our foreign operations
results in translation risk in AOCI. We manage our transaction risk by entering into forward foreign currency
derivative contracts to hedge our exposure to variability in cash flows related to foreign currency denominated
intercompany borrowings. In the third quarter of 2014, we began entering into net investment hedges to manage
108 Capital One Financial Corporation (COF)