Capital One 2014 Annual Report Download - page 76
Download and view the complete annual report
Please find page 76 of the 2014 Capital One annual report below. You can navigate through the pages in the report by either clicking on the pages listed below, or by using the keyword search tool below to find specific information within the annual report.-
 1
1 -
2
-
3
-
4
-
5
-
6
-
7
-
8
-
9
-
10
-
11
-
12
-
13
-
14
-
15
-
16
-
17
-
18
-
19
-
20
-
21
-
22
-
23
-
24
-
25
-
26
-
27
-
28
-
29
-
30
-
31
-
32
-
33
-
34
-
35
-
36
-
37
-
38
-
39
-
40
-
41
-
42
-
43
-
44
-
45
-
46
-
47
-
48
-
49
-
50
-
51
-
52
-
53
-
54
-
55
-
56
-
57
-
58
-
59
-
60
-
61
-
62
-
63
-
64
-
65
-
 66
66 -
 67
67 -
 68
68 -
 69
69 -
 70
70 -
 71
71 -
 72
72 -
 73
73 -
 74
74 -
 75
75 -
 76
76 -
 77
77 -
 78
78 -
 79
79 -
 80
80 -
 81
81 -
 82
82 -
 83
83 -
 84
84 -
 85
85 -
 86
86 -
87
-
88
-
89
-
90
-
91
-
92
-
93
-
94
-
95
-
96
-
97
-
98
-
99
-
100
-
101
-
102
-
103
-
104
-
105
-
106
-
107
-
108
-
109
-
110
-
111
-
112
-
113
-
114
-
115
-
116
-
117
-
118
-
119
-
120
-
121
-
122
-
123
-
124
-
125
-
126
-
127
-
128
-
129
-
130
-
131
-
132
-
133
-
134
-
135
-
136
-
137
-
138
-
139
-
140
-
141
-
142
-
143
-
144
-
145
-
146
-
147
-
148
-
149
-
150
-
151
-
152
-
153
-
154
-
155
-
156
-
157
-
158
-
159
-
160
-
161
-
162
-
163
-
164
-
165
-
166
-
167
-
168
-
169
-
170
-
171
-
172
-
173
-
174
-
175
-
176
-
177
-
178
-
179
-
180
-
181
-
182
-
183
-
184
-
185
-
186
-
187
-
188
-
189
-
190
-
191
-
192
-
193
-
194
-
195
-
196
-
197
-
198
-
199
-
200
-
201
-
202
-
203
-
204
-
205
-
206
-
207
-
208
-
209
-
210
-
211
-
212
-
213
-
214
-
215
-
216
-
217
-
218
-
219
-
220
-
221
-
222
-
223
-
224
-
225
-
226
-
227
-
228
-
229
-
230
-
231
-
232
-
233
-
234
-
235
-
236
-
237
-
238
-
239
-
240
-
241
-
242
-
243
-
244
-
245
-
246
-
247
-
248
-
249
-
250
-
251
-
252
-
253
-
254
-
255
-
256
-
257
-
258
-
259
-
260
-
261
-
262
-
263
-
264
-
265
-
266
-
267
-
268
-
269
-
270
-
271
-
272
-
273
-
274
-
275
-
276
-
277
-
278
-
279
-
280
-
281
-
282
-
283
-
284
-
285
-
286
-
287
-
288
-
289
-
290
-
291
-
292
-
293
-
294
-
295
-
296
-
297
-
298
-
299
-
300
 |
 |

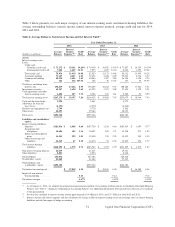
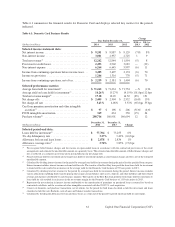
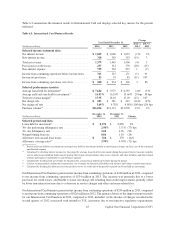
Table 4 displays the components of non-interest income for 2014, 2013 and 2012.
Table 4: Non-Interest Income
Year Ended December 31,
(Dollars in millions) 2014 2013 2012
Service charges and other customer-related fees . . . . . . . . . . . . . . . . . . . . . . . . . . . . $1,867 $2,118 $2,106
Interchange fees, net . . . . . . . . . . . . . . . . . . . . . . . . . . . . . . . . . . . . . . . . . . . . . . . . . 2,021 1,896 1,647
Bargain purchase gain(1) . . . . . . . . . . . . . . . . . . . . . . . . . . . . . . . . . . . . . . . . . . . . . . . —— 594
Net other-than-temporary impairment recognized in earnings . . . . . . . . . . . . . . . . . (24) (41) (52)
Other non-interest income:
Benefit (provision) for mortgage representation and warranty losses(2) . . . . . . . . 26 24 (42)
Net gains from the sale of investment securities . . . . . . . . . . . . . . . . . . . . . . . . . . 21 7 45
Net fair value gains (losses) on free-standing derivatives(3) . . . . . . . . . . . . . . . . . 52 3 (36)
Other(4) . . . . . . . . . . . . . . . . . . . . . . . . . . . . . . . . . . . . . . . . . . . . . . . . . . . . . . . . . 509 271 545
Total other non-interest income . . . . . . . . . . . . . . . . . . . . . . . . . . . . . . . . . . . . . . . . . 608 305 512
Total non-interest income . . . . . . . . . . . . . . . . . . . . . . . . . . . . . . . . . . . . . . . . . . . . . $4,472 $4,278 $4,807
(1) Represents the amount by which the fair value of the net assets acquired in the ING Direct acquisition, as of the acquisition date, exceeded
the consideration transferred.
(2) Represents the benefit (provision) for mortgage representation and warranty losses recorded in continuing operations. For the total impact
to the net benefit (provision) for mortgage representation and warranty losses, including the portion recognized in our consolidated statements
of income as a component of discontinued operations, see “MD&A—Consolidated Balance Sheets Analysis—Table 13: Changes in
Representation and Warranty Reserve.”
(3) Includes mark-to-market derivative losses of $78 million in 2012 related to interest-rate swaps we entered into in 2011 to partially hedge
the interest rate risk of the net assets associated with the ING Direct acquisition.
(4) Includes income of $162 million in 2012 related to the sale of Visa stock shares.
Non-interest income increased by $194 million, or 5%, to $4.5 billion in 2014, compared to $4.3 billion in 2013.
The main drivers for the increase in non-interest income were an increase in interchange fees, net, due to strong
purchase volume in our credit card loan portfolio, partially offset by a decline in our service charges and other
customer-related fees due to strategic choices we made related to our Domestic Card business.
Non-interest income decreased by $529 million, or 11%, to $4.3 billion in 2013, compared to $4.8 billion in 2012.
The decrease in non-interest income reflected the combined impact of the absence of the bargain purchase gain of
$594 million recognized at acquisition of ING Direct and income of $162 million from the sale of Visa stock shares,
both of which were recorded in 2012. The impact of these items was partially offset by the favorable impact of
increased customer related fees and interchange fees from purchase volume growth, due in part to the acquisitions,
fee based products and services revenue, a change to a benefit from a provision for mortgage representation and
warranty losses and a reduction in fair value losses on free-standing derivatives.
Provision for Credit Losses
Our provision for credit losses in each period is driven by net charge-offs, changes to the allowance for loan and
lease losses and changes to the reserve for unfunded lending commitments. We recorded a provision for credit losses
of $3.5 billion in both 2014 and 2013, and a provision for credit losses of $4.4 billion in 2012. The provision for
credit losses as a percentage of net interest income was 19.9%, 19.1%, and 26.6% in 2014, 2013, and 2012,
respectively.
The increase in the provision for credit losses of $88 million in 2014, from 2013, was primarily driven by a small
allowance build of $68 million in 2014 due to loan growth in our domestic card, auto and commercial portfolios, as
compared to a release of $552 million in 2013 due to an improved credit outlook coupled with improvements in
54 Capital One Financial Corporation (COF)