Capital One 2014 Annual Report Download - page 112
Download and view the complete annual report
Please find page 112 of the 2014 Capital One annual report below. You can navigate through the pages in the report by either clicking on the pages listed below, or by using the keyword search tool below to find specific information within the annual report.-
 1
1 -
2
-
3
-
4
-
5
-
6
-
7
-
8
-
9
-
10
-
11
-
12
-
13
-
14
-
15
-
16
-
17
-
18
-
19
-
20
-
21
-
22
-
23
-
24
-
25
-
26
-
27
-
28
-
29
-
30
-
31
-
32
-
33
-
34
-
35
-
36
-
37
-
38
-
39
-
40
-
41
-
42
-
43
-
44
-
45
-
46
-
47
-
48
-
49
-
50
-
51
-
52
-
53
-
54
-
55
-
56
-
57
-
58
-
59
-
60
-
61
-
62
-
63
-
64
-
65
-
66
-
67
-
68
-
69
-
70
-
71
-
72
-
73
-
74
-
75
-
76
-
77
-
78
-
79
-
80
-
81
-
82
-
83
-
84
-
85
-
86
-
87
-
88
-
89
-
90
-
91
-
92
-
93
-
94
-
95
-
96
-
97
-
98
-
99
-
100
-
101
-
 102
102 -
 103
103 -
 104
104 -
 105
105 -
 106
106 -
 107
107 -
 108
108 -
 109
109 -
 110
110 -
 111
111 -
 112
112 -
 113
113 -
 114
114 -
 115
115 -
 116
116 -
 117
117 -
 118
118 -
 119
119 -
 120
120 -
 121
121 -
 122
122 -
123
-
124
-
125
-
126
-
127
-
128
-
129
-
130
-
131
-
132
-
133
-
134
-
135
-
136
-
137
-
138
-
139
-
140
-
141
-
142
-
143
-
144
-
145
-
146
-
147
-
148
-
149
-
150
-
151
-
152
-
153
-
154
-
155
-
156
-
157
-
158
-
159
-
160
-
161
-
162
-
163
-
164
-
165
-
166
-
167
-
168
-
169
-
170
-
171
-
172
-
173
-
174
-
175
-
176
-
177
-
178
-
179
-
180
-
181
-
182
-
183
-
184
-
185
-
186
-
187
-
188
-
189
-
190
-
191
-
192
-
193
-
194
-
195
-
196
-
197
-
198
-
199
-
200
-
201
-
202
-
203
-
204
-
205
-
206
-
207
-
208
-
209
-
210
-
211
-
212
-
213
-
214
-
215
-
216
-
217
-
218
-
219
-
220
-
221
-
222
-
223
-
224
-
225
-
226
-
227
-
228
-
229
-
230
-
231
-
232
-
233
-
234
-
235
-
236
-
237
-
238
-
239
-
240
-
241
-
242
-
243
-
244
-
245
-
246
-
247
-
248
-
249
-
250
-
251
-
252
-
253
-
254
-
255
-
256
-
257
-
258
-
259
-
260
-
261
-
262
-
263
-
264
-
265
-
266
-
267
-
268
-
269
-
270
-
271
-
272
-
273
-
274
-
275
-
276
-
277
-
278
-
279
-
280
-
281
-
282
-
283
-
284
-
285
-
286
-
287
-
288
-
289
-
290
-
291
-
292
-
293
-
294
-
295
-
296
-
297
-
298
-
299
-
300
 |
 |
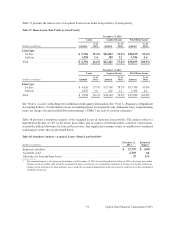
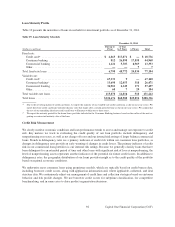
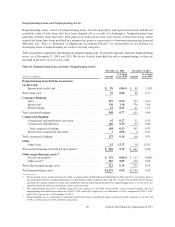
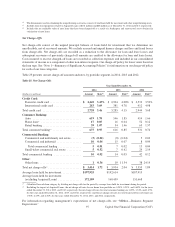
We operate our Commercial Banking business primarily in geographic regions where we maintain retail bank
branches. Accordingly, the portfolio is concentrated in New York, Louisiana and Texas, which represent our largest
retail banking markets. Our small ticket commercial real estate portfolio, which was originated on a national basis
through a broker network, is in a run-off mode.
We provide additional information on the geographic concentration, by loan category, of our loan portfolio in
“Note 4—Loans.”
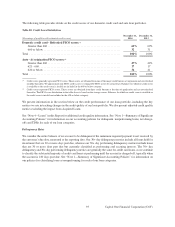
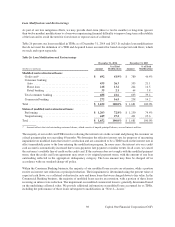
Acquired Loans
Our portfolio of loans held for investment includes loans acquired in the ING Direct, CCB and 2012 U.S. card
acquisitions. These loans were recorded at fair value at the date of each acquisition. Acquired Loans accounted for
based on expected cash flows to be collected was $23.5 billion as of December 31, 2014, compared to $28.6 billion
as of December 31, 2013.
The difference between the fair value at acquisition and expected cash flows represents the accretable yield, which
is recognized in interest income over the life of the loans. The difference between the contractual payments on the
loans and expected cash flows represents the nonaccretable difference or the amount of principal and interest not
considered collectible, which incorporates future expected credit losses over the life of the loans. We regularly update
our estimate of expected principal and interest to be collected from these loans and evaluate the results for each
accounting pool that was established at acquisition based on loans with common risk characteristics. Probable
decreases in expected cash flows would trigger the recognition of an allowance for loan and lease losses through
our provision for credit losses. Probable and significant increases in expected cash flows would first reverse any
previously recorded allowance for loan and lease losses established subsequent to acquisition, with any remaining
increase in expected cash flows recognized prospectively in interest income over the remaining estimated life of the
underlying loans. See “Note 1—Summary of Significant Accounting Policies” for additional information on Acquired
Loans.
Home Loans
The substantial majority of our home loan portfolio was acquired in the ING Direct and CCB acquisitions, and they
accounted for 98.9% and 98.7% of our total Acquired Loans as of December 31, 2014 and 2013, respectively. The
expected cash flows for our acquired home loan portfolio are significantly impacted by future expectations of home
prices and interest rates. Decreases in expected cash flows that result from declining conditions, particularly
associated with these variables, could result in an increase in the allowance for loan and lease losses and reduction
in accretable yield.
Charge-offs on these loans are not recorded until the expected credit losses within the nonaccretable difference is
depleted. In addition, Acquired Loans are not initially classified as delinquent or nonperforming as we expect to
collect our net investment in these loans and the nonaccretable difference is expected to absorb the majority of the
losses associated with these loans. The period-end carrying value of Acquired Loans in our home loan portfolio was
$23.2 billion and $28.2 billion as of December 31, 2014 and 2013, respectively.
90 Capital One Financial Corporation (COF)