Capital One 2014 Annual Report Download - page 201
Download and view the complete annual report
Please find page 201 of the 2014 Capital One annual report below. You can navigate through the pages in the report by either clicking on the pages listed below, or by using the keyword search tool below to find specific information within the annual report.-
 1
1 -
2
-
3
-
4
-
5
-
6
-
7
-
8
-
9
-
10
-
11
-
12
-
13
-
14
-
15
-
16
-
17
-
18
-
19
-
20
-
21
-
22
-
23
-
24
-
25
-
26
-
27
-
28
-
29
-
30
-
31
-
32
-
33
-
34
-
35
-
36
-
37
-
38
-
39
-
40
-
41
-
42
-
43
-
44
-
45
-
46
-
47
-
48
-
49
-
50
-
51
-
52
-
53
-
54
-
55
-
56
-
57
-
58
-
59
-
60
-
61
-
62
-
63
-
64
-
65
-
66
-
67
-
68
-
69
-
70
-
71
-
72
-
73
-
74
-
75
-
76
-
77
-
78
-
79
-
80
-
81
-
82
-
83
-
84
-
85
-
86
-
87
-
88
-
89
-
90
-
91
-
92
-
93
-
94
-
95
-
96
-
97
-
98
-
99
-
100
-
101
-
102
-
103
-
104
-
105
-
106
-
107
-
108
-
109
-
110
-
111
-
112
-
113
-
114
-
115
-
116
-
117
-
118
-
119
-
120
-
121
-
122
-
123
-
124
-
125
-
126
-
127
-
128
-
129
-
130
-
131
-
132
-
133
-
134
-
135
-
136
-
137
-
138
-
139
-
140
-
141
-
142
-
143
-
144
-
145
-
146
-
147
-
148
-
149
-
150
-
151
-
152
-
153
-
154
-
155
-
156
-
157
-
158
-
159
-
160
-
161
-
162
-
163
-
164
-
165
-
166
-
167
-
168
-
169
-
170
-
171
-
172
-
173
-
174
-
175
-
176
-
177
-
178
-
179
-
180
-
181
-
182
-
183
-
184
-
185
-
186
-
187
-
188
-
189
-
190
-
 191
191 -
 192
192 -
 193
193 -
 194
194 -
 195
195 -
 196
196 -
 197
197 -
 198
198 -
 199
199 -
 200
200 -
 201
201 -
 202
202 -
 203
203 -
 204
204 -
 205
205 -
 206
206 -
 207
207 -
 208
208 -
 209
209 -
 210
210 -
 211
211 -
212
-
213
-
214
-
215
-
216
-
217
-
218
-
219
-
220
-
221
-
222
-
223
-
224
-
225
-
226
-
227
-
228
-
229
-
230
-
231
-
232
-
233
-
234
-
235
-
236
-
237
-
238
-
239
-
240
-
241
-
242
-
243
-
244
-
245
-
246
-
247
-
248
-
249
-
250
-
251
-
252
-
253
-
254
-
255
-
256
-
257
-
258
-
259
-
260
-
261
-
262
-
263
-
264
-
265
-
266
-
267
-
268
-
269
-
270
-
271
-
272
-
273
-
274
-
275
-
276
-
277
-
278
-
279
-
280
-
281
-
282
-
283
-
284
-
285
-
286
-
287
-
288
-
289
-
290
-
291
-
292
-
293
-
294
-
295
-
296
-
297
-
298
-
299
-
300
 |
 |

179
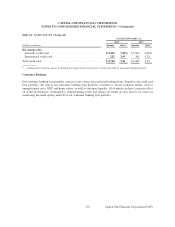
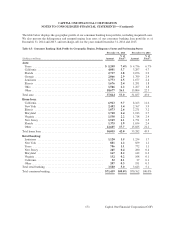
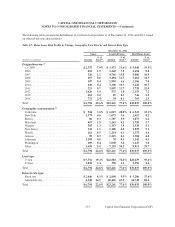
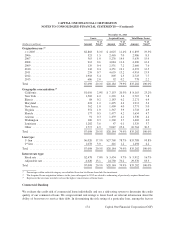
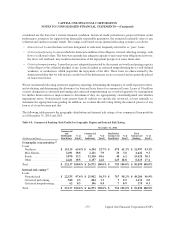
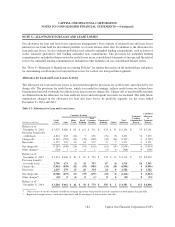
As part of our loan modifications to borrowers experiencing financial difficulty, we may provide multiple
concessions to minimize our economic loss and improve long-term loan performance and collectability. The
following tables present the types, amounts and financial effects of loans modified and accounted for as TDRs
during the period:
Table 4.10: Troubled Debt Restructurings
Year Ended December 31, 2014
Reduced Interest Rate Term Extension Balance Reduction
Average
Total % of Average % of Term % of Gross
Loans TDR Rate TDR Extension TDR Balance
(Dollars in millions) Modified(1) Activity(2)(3) Reduction(4) Activity(3)(5) (Months)(6) Activity(3)(7) Reduction(8)
Credit Card:
Domestic credit card . . . . . . . . . . $ 269 100% 11.59% 0% 0 0% $ 0
International credit card . . . . . . . 149 100 25.39 0 0 0 0
Total credit card . . . . . . . . . . . . . . . 418 100 16.51 0 0 0 0
Consumer Banking:
Auto . . . . . . . . . . . . . . . . . . . . . . . 334 39 1.38 65 9 34 102
Home loan . . . . . . . . . . . . . . . . . . 35 31 2.60 38 152 5 1
Retail banking . . . . . . . . . . . . . . . 11 10 4.21 67 9 0 0
Total consumer banking . . . . . . . . . 380 37 1.50 63 17 30 103
Commercial Banking:
Commercial and multifamily
real estate . . . . . . . . . . . . . . . . . 72 35 1.31 93 8 6 2
Commercial and industrial . . . . . 101 3 1.66 62 9 1 1
Total commercial lending . . . . 173 17 1.35 75 9 3 3
Small-ticket commercial real estate 2 0 0.00 0 0 0 0
Total commercial banking . . . . . . . 175 17 1.35 74 9 3 3
Total . . . . . . . . . . . . . . . . . . . . . . . . $ 973 60 12.17 38 14 12 $ 106
CAPITAL ONE FINANCIAL CORPORATION
NOTES TO CONSOLIDATED FINANCIAL STATEMENTS—(Continued)
Capital One Financial Corporation (COF)