Capital One 2014 Annual Report Download - page 206
Download and view the complete annual report
Please find page 206 of the 2014 Capital One annual report below. You can navigate through the pages in the report by either clicking on the pages listed below, or by using the keyword search tool below to find specific information within the annual report.-
 1
1 -
2
-
3
-
4
-
5
-
6
-
7
-
8
-
9
-
10
-
11
-
12
-
13
-
14
-
15
-
16
-
17
-
18
-
19
-
20
-
21
-
22
-
23
-
24
-
25
-
26
-
27
-
28
-
29
-
30
-
31
-
32
-
33
-
34
-
35
-
36
-
37
-
38
-
39
-
40
-
41
-
42
-
43
-
44
-
45
-
46
-
47
-
48
-
49
-
50
-
51
-
52
-
53
-
54
-
55
-
56
-
57
-
58
-
59
-
60
-
61
-
62
-
63
-
64
-
65
-
66
-
67
-
68
-
69
-
70
-
71
-
72
-
73
-
74
-
75
-
76
-
77
-
78
-
79
-
80
-
81
-
82
-
83
-
84
-
85
-
86
-
87
-
88
-
89
-
90
-
91
-
92
-
93
-
94
-
95
-
96
-
97
-
98
-
99
-
100
-
101
-
102
-
103
-
104
-
105
-
106
-
107
-
108
-
109
-
110
-
111
-
112
-
113
-
114
-
115
-
116
-
117
-
118
-
119
-
120
-
121
-
122
-
123
-
124
-
125
-
126
-
127
-
128
-
129
-
130
-
131
-
132
-
133
-
134
-
135
-
136
-
137
-
138
-
139
-
140
-
141
-
142
-
143
-
144
-
145
-
146
-
147
-
148
-
149
-
150
-
151
-
152
-
153
-
154
-
155
-
156
-
157
-
158
-
159
-
160
-
161
-
162
-
163
-
164
-
165
-
166
-
167
-
168
-
169
-
170
-
171
-
172
-
173
-
174
-
175
-
176
-
177
-
178
-
179
-
180
-
181
-
182
-
183
-
184
-
185
-
186
-
187
-
188
-
189
-
190
-
191
-
192
-
193
-
194
-
195
-
 196
196 -
 197
197 -
 198
198 -
 199
199 -
 200
200 -
 201
201 -
 202
202 -
 203
203 -
 204
204 -
 205
205 -
 206
206 -
 207
207 -
 208
208 -
 209
209 -
 210
210 -
 211
211 -
 212
212 -
 213
213 -
 214
214 -
 215
215 -
 216
216 -
217
-
218
-
219
-
220
-
221
-
222
-
223
-
224
-
225
-
226
-
227
-
228
-
229
-
230
-
231
-
232
-
233
-
234
-
235
-
236
-
237
-
238
-
239
-
240
-
241
-
242
-
243
-
244
-
245
-
246
-
247
-
248
-
249
-
250
-
251
-
252
-
253
-
254
-
255
-
256
-
257
-
258
-
259
-
260
-
261
-
262
-
263
-
264
-
265
-
266
-
267
-
268
-
269
-
270
-
271
-
272
-
273
-
274
-
275
-
276
-
277
-
278
-
279
-
280
-
281
-
282
-
283
-
284
-
285
-
286
-
287
-
288
-
289
-
290
-
291
-
292
-
293
-
294
-
295
-
296
-
297
-
298
-
299
-
300
 |
 |

184
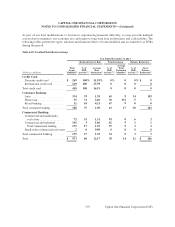
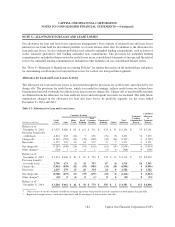
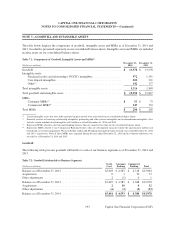
NOTE 5—ALLOWANCE FOR LOAN AND LEASE LOSSES
Our allowance for loan and lease losses represents management’s best estimate of incurred loan and lease losses
inherent in our loans held for investment portfolio as of each balance sheet date. In addition to the allowance for
loan and lease losses, we also estimate probable losses related to unfunded lending commitments, such as letters of
credit, financial guarantees, and binding unfunded loan commitments. The provision for unfunded lending
commitments is included in the provision for credit losses in our consolidated statements of income and the related
reserve for unfunded lending commitments is included in other liabilities on our consolidated balance sheets.
See “Note 1—Summary of Significant Accounting Policies” for further discussion on the methodology and policy
for determining our allowance for loan and lease losses for each of our loan portfolio segments.
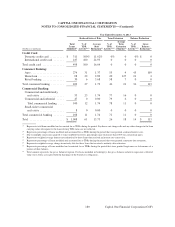
Allowance for Loan and Lease Losses Activity
The allowance for loan and lease losses is increased through the provision for credit losses and reduced by net
charge-offs. The provision for credit losses, which is recorded in earnings, reflects credit losses we believe have
been incurred and will eventually be reflected over time in our net charge-offs. Charge-offs of uncollectible amounts
are deducted from the allowance for loan and lease losses and subsequent recoveries are included. The table below
summarizes changes in the allowance for loan and lease losses, by portfolio segment, for the years ended
December 31, 2014 and 2013:
Table 5.1: Allowance for Loan and Lease Losses
Combined
Consumer Banking Unfunded Allowance
Total Lending &
Credit Home Retail Consumer Commercial Total Commitments Unfunded
(Dollars in millions) Card Auto Loan Banking Banking Banking Other(1) Allowance Reserve Reserve
Balance as of
December 31, 2012 . . . $ 3,979 $ 486 $ 113 $ 112 $ 711 $ 433 $ 33 $ 5,156 $ 35 $ 5,191
Provision (benefit) for
credit losses . . . . . . . . . 2,824 665 (14) 5 656 (76) (3) 3,401 52 3,453
Charge-offs . . . . . . . . . . . (4,542) (784) (26) (78) (888) (49) (26) (5,505) 0 (5,505)
Recoveries . . . . . . . . . . . 1,257 238 10 24 272 35 7 1,571 0 1,571
Net charge-offs . . . . . . . . (3,285) (546) (16) (54) (616) (14) (19) (3,934) 0 (3,934)
Other changes(2) . . . . . . . (304) 1 0 0 1 (5) 0 (308) 0 (308)
Balance as of
December 31, 2013 . . . $ 3,214 $ 606 $ 83 $ 63 $ 752 $ 338 $ 11 $ 4,315 $ 87 $ 4,402
Provision (benefit)
for credit losses . . . . . . . 2,750 674 (3) 32 703 67 (5) 3,515 26 3,541
Charge-offs . . . . . . . . . . . (3,963) (898) (32) (59) (989) (34) (10) (4,996) 0 (4,996)
Recoveries . . . . . . . . . . . 1,235 279 15 20 314 24 9 1,582 0 1,582
Net charge-offs . . . . . . . . (2,728) (619) (17) (39) (675) (10) (1) (3,414) 0 (3,414)
Other changes(2) . . . . . . . (32) 0 (1) 0 (1) 0 0 (33) 0 (33)
Balance as of
December 31, 2014 . . . $ 3,204 $ 661 $ 62 $ 56 $ 779 $ 395 $ 5 $ 4,383 $ 113 $ 4,496
(1) Other consists of our discontinued GreenPoint mortgage operations loan portfolio and our community redevelopment loan portfolio.
(2) Represents foreign currency translation adjustments and the net impact of loan transfers and sales.
CAPITAL ONE FINANCIAL CORPORATION
NOTES TO CONSOLIDATED FINANCIAL STATEMENTS—(Continued)
Capital One Financial Corporation (COF)