Capital One 2014 Annual Report Download - page 260
Download and view the complete annual report
Please find page 260 of the 2014 Capital One annual report below. You can navigate through the pages in the report by either clicking on the pages listed below, or by using the keyword search tool below to find specific information within the annual report.-
 1
1 -
2
-
3
-
4
-
5
-
6
-
7
-
8
-
9
-
10
-
11
-
12
-
13
-
14
-
15
-
16
-
17
-
18
-
19
-
20
-
21
-
22
-
23
-
24
-
25
-
26
-
27
-
28
-
29
-
30
-
31
-
32
-
33
-
34
-
35
-
36
-
37
-
38
-
39
-
40
-
41
-
42
-
43
-
44
-
45
-
46
-
47
-
48
-
49
-
50
-
51
-
52
-
53
-
54
-
55
-
56
-
57
-
58
-
59
-
60
-
61
-
62
-
63
-
64
-
65
-
66
-
67
-
68
-
69
-
70
-
71
-
72
-
73
-
74
-
75
-
76
-
77
-
78
-
79
-
80
-
81
-
82
-
83
-
84
-
85
-
86
-
87
-
88
-
89
-
90
-
91
-
92
-
93
-
94
-
95
-
96
-
97
-
98
-
99
-
100
-
101
-
102
-
103
-
104
-
105
-
106
-
107
-
108
-
109
-
110
-
111
-
112
-
113
-
114
-
115
-
116
-
117
-
118
-
119
-
120
-
121
-
122
-
123
-
124
-
125
-
126
-
127
-
128
-
129
-
130
-
131
-
132
-
133
-
134
-
135
-
136
-
137
-
138
-
139
-
140
-
141
-
142
-
143
-
144
-
145
-
146
-
147
-
148
-
149
-
150
-
151
-
152
-
153
-
154
-
155
-
156
-
157
-
158
-
159
-
160
-
161
-
162
-
163
-
164
-
165
-
166
-
167
-
168
-
169
-
170
-
171
-
172
-
173
-
174
-
175
-
176
-
177
-
178
-
179
-
180
-
181
-
182
-
183
-
184
-
185
-
186
-
187
-
188
-
189
-
190
-
191
-
192
-
193
-
194
-
195
-
196
-
197
-
198
-
199
-
200
-
201
-
202
-
203
-
204
-
205
-
206
-
207
-
208
-
209
-
210
-
211
-
212
-
213
-
214
-
215
-
216
-
217
-
218
-
219
-
220
-
221
-
222
-
223
-
224
-
225
-
226
-
227
-
228
-
229
-
230
-
231
-
232
-
233
-
234
-
235
-
236
-
237
-
238
-
239
-
240
-
241
-
242
-
243
-
244
-
245
-
246
-
247
-
248
-
249
-
 250
250 -
 251
251 -
 252
252 -
 253
253 -
 254
254 -
 255
255 -
 256
256 -
 257
257 -
 258
258 -
 259
259 -
 260
260 -
 261
261 -
 262
262 -
 263
263 -
 264
264 -
 265
265 -
 266
266 -
 267
267 -
 268
268 -
 269
269 -
 270
270 -
271
-
272
-
273
-
274
-
275
-
276
-
277
-
278
-
279
-
280
-
281
-
282
-
283
-
284
-
285
-
286
-
287
-
288
-
289
-
290
-
291
-
292
-
293
-
294
-
295
-
296
-
297
-
298
-
299
-
300
 |
 |

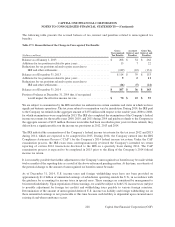
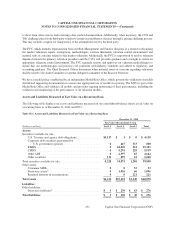
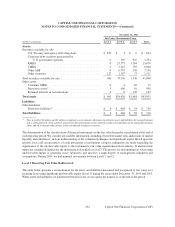
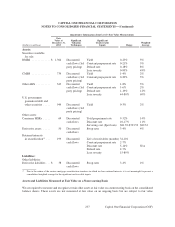
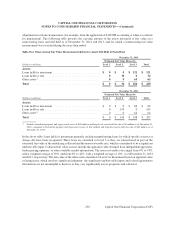
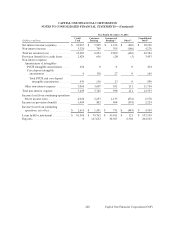
adjustments in certain circumstances (for example, from the application of LOCOM accounting or when we evaluate
for impairment). The following table presents the carrying amount of the assets measured at fair value on a
nonrecurring basis and still held as of December 31, 2014 and 2013, and for which a nonrecurring fair value
measurement was recorded during the years then ended:
Table 18.4: Nonrecurring Fair Value Measurements Related to Assets Still Held at Period End
December 31, 2014
Estimated Fair Value Hierarchy
(Dollars in millions) Level 1 Level 2 Level 3 Total
Assets:
Loans held for investment . . . . . . . . . . . . . . . . . . . . . . . . . . . . . . . . . $ 0 $ 0 $ 121 $ 121
Loans held for sale . . . . . . . . . . . . . . . . . . . . . . . . . . . . . . . . . . . . . . . 0 34 0 34
Other assets(1) . . . . . . . . . . . . . . . . . . . . . . . . . . . . . . . . . . . . . . . . . . . 0 0 65 65
Total . . . . . . . . . . . . . . . . . . . . . . . . . . . . . . . . . . . . . . . . . . . . . . . . . $ 0 $ 34 $ 186 $ 220
December 31, 2013
Estimated Fair Value Hierarchy
(Dollars in millions) Level 1 Level 2 Level 3 Total
Assets:
Loans held for investment . . . . . . . . . . . . . . . . . . . . . . . . . . . . . . . . . $ 0 $ 0 $ 84 $ 84
Loans held for sale . . . . . . . . . . . . . . . . . . . . . . . . . . . . . . . . . . . . . . . 0 145 0 145
Other assets(1) . . . . . . . . . . . . . . . . . . . . . . . . . . . . . . . . . . . . . . . . . . . 0 0 64 64
Total . . . . . . . . . . . . . . . . . . . . . . . . . . . . . . . . . . . . . . . . . . . . . . . . . $ 0 $ 145 $ 148 $ 293
(1) Includes foreclosed property and repossessed assets of $60 million and long-lived assets held for sale of $5 million as of December 31,
2014, compared to foreclosed property and repossessed assets of $42 million and long-lived assets held for sale of $22 million as of
December 31, 2013.
In the above table, loans held for investment primarily include nonperforming loans for which specific reserves or
charge-offs have been recognized. These loans are classified as Level 3 as they are valued based in part on the
estimated fair value of the underlying collateral and the non-recoverable rate, which is considered to be a significant
unobservable input. Collateral fair value sources include the appraisal value obtained from independent appraisers,
broker pricing opinions, or other available market information. The non-recoverable rate ranged from 0% to 74%,
with a weighted average of 30%, and from 0% to 42%, with a weighted average of 13%, as of December 31, 2014
and 2013, respectively. The fair value of the other assets classified as Level 3 is determined based on appraisal value
or listing price which involves significant judgment; the significant unobservable inputs and related quantitative
information are not meaningful to disclose as they vary significantly across properties and collateral.
238
CAPITAL ONE FINANCIAL CORPORATION
NOTES TO CONSOLIDATED FINANCIAL STATEMENTS—(Continued)
Capital One Financial Corporation (COF)