Capital One 2014 Annual Report Download - page 72
Download and view the complete annual report
Please find page 72 of the 2014 Capital One annual report below. You can navigate through the pages in the report by either clicking on the pages listed below, or by using the keyword search tool below to find specific information within the annual report.-
 1
1 -
2
-
3
-
4
-
5
-
6
-
7
-
8
-
9
-
10
-
11
-
12
-
13
-
14
-
15
-
16
-
17
-
18
-
19
-
20
-
21
-
22
-
23
-
24
-
25
-
26
-
27
-
28
-
29
-
30
-
31
-
32
-
33
-
34
-
35
-
36
-
37
-
38
-
39
-
40
-
41
-
42
-
43
-
44
-
45
-
46
-
47
-
48
-
49
-
50
-
51
-
52
-
53
-
54
-
55
-
56
-
57
-
58
-
59
-
60
-
61
-
 62
62 -
 63
63 -
 64
64 -
 65
65 -
 66
66 -
 67
67 -
 68
68 -
 69
69 -
 70
70 -
 71
71 -
 72
72 -
 73
73 -
 74
74 -
 75
75 -
 76
76 -
 77
77 -
 78
78 -
 79
79 -
 80
80 -
 81
81 -
 82
82 -
83
-
84
-
85
-
86
-
87
-
88
-
89
-
90
-
91
-
92
-
93
-
94
-
95
-
96
-
97
-
98
-
99
-
100
-
101
-
102
-
103
-
104
-
105
-
106
-
107
-
108
-
109
-
110
-
111
-
112
-
113
-
114
-
115
-
116
-
117
-
118
-
119
-
120
-
121
-
122
-
123
-
124
-
125
-
126
-
127
-
128
-
129
-
130
-
131
-
132
-
133
-
134
-
135
-
136
-
137
-
138
-
139
-
140
-
141
-
142
-
143
-
144
-
145
-
146
-
147
-
148
-
149
-
150
-
151
-
152
-
153
-
154
-
155
-
156
-
157
-
158
-
159
-
160
-
161
-
162
-
163
-
164
-
165
-
166
-
167
-
168
-
169
-
170
-
171
-
172
-
173
-
174
-
175
-
176
-
177
-
178
-
179
-
180
-
181
-
182
-
183
-
184
-
185
-
186
-
187
-
188
-
189
-
190
-
191
-
192
-
193
-
194
-
195
-
196
-
197
-
198
-
199
-
200
-
201
-
202
-
203
-
204
-
205
-
206
-
207
-
208
-
209
-
210
-
211
-
212
-
213
-
214
-
215
-
216
-
217
-
218
-
219
-
220
-
221
-
222
-
223
-
224
-
225
-
226
-
227
-
228
-
229
-
230
-
231
-
232
-
233
-
234
-
235
-
236
-
237
-
238
-
239
-
240
-
241
-
242
-
243
-
244
-
245
-
246
-
247
-
248
-
249
-
250
-
251
-
252
-
253
-
254
-
255
-
256
-
257
-
258
-
259
-
260
-
261
-
262
-
263
-
264
-
265
-
266
-
267
-
268
-
269
-
270
-
271
-
272
-
273
-
274
-
275
-
276
-
277
-
278
-
279
-
280
-
281
-
282
-
283
-
284
-
285
-
286
-
287
-
288
-
289
-
290
-
291
-
292
-
293
-
294
-
295
-
296
-
297
-
298
-
299
-
300
 |
 |

ACCOUNTING CHANGES AND DEVELOPMENTS
Accounting for Investments in Qualified Affordable Housing Projects
In January 2014, the Financial Accounting Standards Board issued guidance permitting an entity to account for
Investments in Qualified Affordable Housing Projects using the proportional amortization method, if certain criteria
are met. The proportional method amortizes the cost of the investment over the period in which the investor expects
to receive tax credits and other tax benefits, and the resulting amortization is recognized as a component of income
taxes attributable to continuing operations. Historically, these investments were accounted for under the equity method
and the passive losses related to the investments were recognized within non-interest expense. We adopted this
guidance as of January 1, 2014 with retrospective application. See “Note 1—Summary of Significant Accounting
Policies” for more information.
CONSOLIDATED RESULTS OF OPERATIONS
The section below provides a comparative discussion of our consolidated financial performance for 2014, 2013 and
2012. Following this section, we provide a discussion of our business segment results. You should read this section
together with our “Executive Summary and Business Outlook” where we discuss trends and other factors that we
expect will affect our future results of operations.
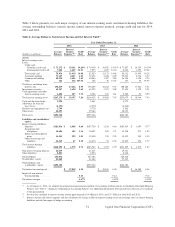
Net Interest Income
Net interest income represents the difference between the interest income, including certain fees, earned on our
interest-earning assets and the interest expense on our interest-bearing liabilities. Interest-earning assets include loans,
investment securities and other interest-earning assets and interest-bearing liabilities include interest-bearing deposits,
securitized debt obligations, senior and subordinated notes, and other borrowings. Generally, we include in interest
income any past due fees on loans that we deem collectible. Our net interest margin, based on our consolidated results,
represents the difference between the yield on our interest-earning assets and the cost of our interest-bearing liabilities,
including the notional impact of non-interest bearing funding. We expect net interest income and our net interest
margin to fluctuate based on changes in interest rates and changes in the amount and composition of our interest-
earning assets and interest-bearing liabilities.
50 Capital One Financial Corporation (COF)