Capital One 2014 Annual Report Download - page 132
Download and view the complete annual report
Please find page 132 of the 2014 Capital One annual report below. You can navigate through the pages in the report by either clicking on the pages listed below, or by using the keyword search tool below to find specific information within the annual report.-
 1
1 -
2
-
3
-
4
-
5
-
6
-
7
-
8
-
9
-
10
-
11
-
12
-
13
-
14
-
15
-
16
-
17
-
18
-
19
-
20
-
21
-
22
-
23
-
24
-
25
-
26
-
27
-
28
-
29
-
30
-
31
-
32
-
33
-
34
-
35
-
36
-
37
-
38
-
39
-
40
-
41
-
42
-
43
-
44
-
45
-
46
-
47
-
48
-
49
-
50
-
51
-
52
-
53
-
54
-
55
-
56
-
57
-
58
-
59
-
60
-
61
-
62
-
63
-
64
-
65
-
66
-
67
-
68
-
69
-
70
-
71
-
72
-
73
-
74
-
75
-
76
-
77
-
78
-
79
-
80
-
81
-
82
-
83
-
84
-
85
-
86
-
87
-
88
-
89
-
90
-
91
-
92
-
93
-
94
-
95
-
96
-
97
-
98
-
99
-
100
-
101
-
102
-
103
-
104
-
105
-
106
-
107
-
108
-
109
-
110
-
111
-
112
-
113
-
114
-
115
-
116
-
117
-
118
-
119
-
120
-
121
-
 122
122 -
 123
123 -
 124
124 -
 125
125 -
 126
126 -
 127
127 -
 128
128 -
 129
129 -
 130
130 -
 131
131 -
 132
132 -
 133
133 -
 134
134 -
 135
135 -
 136
136 -
 137
137 -
 138
138 -
 139
139 -
 140
140 -
 141
141 -
 142
142 -
143
-
144
-
145
-
146
-
147
-
148
-
149
-
150
-
151
-
152
-
153
-
154
-
155
-
156
-
157
-
158
-
159
-
160
-
161
-
162
-
163
-
164
-
165
-
166
-
167
-
168
-
169
-
170
-
171
-
172
-
173
-
174
-
175
-
176
-
177
-
178
-
179
-
180
-
181
-
182
-
183
-
184
-
185
-
186
-
187
-
188
-
189
-
190
-
191
-
192
-
193
-
194
-
195
-
196
-
197
-
198
-
199
-
200
-
201
-
202
-
203
-
204
-
205
-
206
-
207
-
208
-
209
-
210
-
211
-
212
-
213
-
214
-
215
-
216
-
217
-
218
-
219
-
220
-
221
-
222
-
223
-
224
-
225
-
226
-
227
-
228
-
229
-
230
-
231
-
232
-
233
-
234
-
235
-
236
-
237
-
238
-
239
-
240
-
241
-
242
-
243
-
244
-
245
-
246
-
247
-
248
-
249
-
250
-
251
-
252
-
253
-
254
-
255
-
256
-
257
-
258
-
259
-
260
-
261
-
262
-
263
-
264
-
265
-
266
-
267
-
268
-
269
-
270
-
271
-
272
-
273
-
274
-
275
-
276
-
277
-
278
-
279
-
280
-
281
-
282
-
283
-
284
-
285
-
286
-
287
-
288
-
289
-
290
-
291
-
292
-
293
-
294
-
295
-
296
-
297
-
298
-
299
-
300
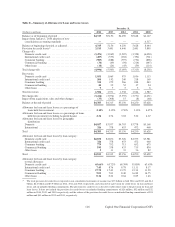
 |
 |

derivative hedging activity, and changes in the fair value of free-standing interest rate swaps. In addition to our
existing assets and liabilities, we incorporate expected future business growth assumptions, such as loan and
deposit growth and pricing, and plans for projected changes in our funding mix in our baseline forecast. In
measuring the sensitivity of interest rate movements on our projected interest rate sensitive revenue, we assume
an instantaneous plus 200 basis points and minus 50 basis points shock, with the lower rate scenario limited to
zero as described above.
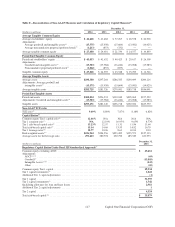
Economic Value of Equity
Our economic value of equity sensitivity measure estimates the impact on the net present value of our assets and
liabilities, including derivative hedging activity, resulting from movements in interest rates. Our economic value of
equity sensitivity measures are calculated based on our existing assets and liabilities, including derivatives, and do
not incorporate business growth assumptions or projected plans for funding mix changes. In measuring the sensitivity
of interest rate movements on our economic value of equity, we assume a hypothetical instantaneous parallel shift
in the level of interest rates of +200 basis points and -50 basis points to spot rates, with the lower rate scenario
limited to zero as described above.
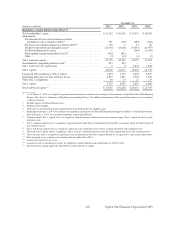
In the fourth quarter of 2014, we updated the models and associated assumptions for certain deposits in our Consumer
Banking business. Our new deposit model was developed based on account-level data and incorporates lagged
responses in both repricing and customer behavior as external market rates change. The modeling changes had a
small impact on our economic value of equity sensitivity measure, but resulted in a larger impact to our next 12-
month net interest income sensitivity. Accordingly, our net interest income sensitivity metric shows more asset
sensitivity over the first 12 months, moving from 3.4% in a +200 basis point instantaneous parallel shock shift (under
the previous methodology) to 4.5% using the new deposit model.
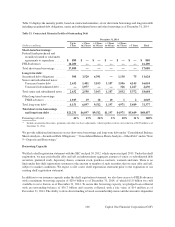
Table 36 shows the estimated percentage impact on our projected base-line net interest income and economic
value of equity as of December 31, 2014, calculated under the revised methodology described above. It also
includes an estimate of the measures as of December 31, 2014 and 2013 calculated under the previous
methodology.
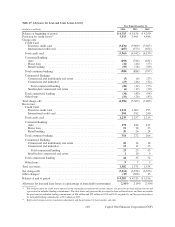
Table 36: Interest Rate Sensitivity Analysis
Revised Methodology Previous Methodology
December 31, December 31, December 31, December 31,
2014 2013 2014 2013
Estimated impact on projected base-line
net interest income
+200 basis points . . . . . . . . . . . . . . . . . . . . . . . . . . . 4.5% N/A 3.4% 4.9%
–50 basis points . . . . . . . . . . . . . . . . . . . . . . . . . . . . (2.1) N/A (2.1) (1.5)
Estimated impact on economic value of equity
+200 basis points . . . . . . . . . . . . . . . . . . . . . . . . . . . (3.4) N/A (3.8) (5.7)
–50 basis points . . . . . . . . . . . . . . . . . . . . . . . . . . . . (1.2) N/A (1.1) 0.3
Our projected net interest income and economic value of equity sensitivity measures were within our prescribed
asset/liability policy limits as of December 31, 2014 and 2013. In addition to these industry standard measures, we
will continue to factor into our internal interest rate risk management decisions the potential impact of alternative
interest rate scenarios, such as stressed rate shocks as well as steepening and flattening yield curve scenarios.
110 Capital One Financial Corporation (COF)