Capital One 2014 Annual Report Download - page 252
Download and view the complete annual report
Please find page 252 of the 2014 Capital One annual report below. You can navigate through the pages in the report by either clicking on the pages listed below, or by using the keyword search tool below to find specific information within the annual report.-
 1
1 -
2
-
3
-
4
-
5
-
6
-
7
-
8
-
9
-
10
-
11
-
12
-
13
-
14
-
15
-
16
-
17
-
18
-
19
-
20
-
21
-
22
-
23
-
24
-
25
-
26
-
27
-
28
-
29
-
30
-
31
-
32
-
33
-
34
-
35
-
36
-
37
-
38
-
39
-
40
-
41
-
42
-
43
-
44
-
45
-
46
-
47
-
48
-
49
-
50
-
51
-
52
-
53
-
54
-
55
-
56
-
57
-
58
-
59
-
60
-
61
-
62
-
63
-
64
-
65
-
66
-
67
-
68
-
69
-
70
-
71
-
72
-
73
-
74
-
75
-
76
-
77
-
78
-
79
-
80
-
81
-
82
-
83
-
84
-
85
-
86
-
87
-
88
-
89
-
90
-
91
-
92
-
93
-
94
-
95
-
96
-
97
-
98
-
99
-
100
-
101
-
102
-
103
-
104
-
105
-
106
-
107
-
108
-
109
-
110
-
111
-
112
-
113
-
114
-
115
-
116
-
117
-
118
-
119
-
120
-
121
-
122
-
123
-
124
-
125
-
126
-
127
-
128
-
129
-
130
-
131
-
132
-
133
-
134
-
135
-
136
-
137
-
138
-
139
-
140
-
141
-
142
-
143
-
144
-
145
-
146
-
147
-
148
-
149
-
150
-
151
-
152
-
153
-
154
-
155
-
156
-
157
-
158
-
159
-
160
-
161
-
162
-
163
-
164
-
165
-
166
-
167
-
168
-
169
-
170
-
171
-
172
-
173
-
174
-
175
-
176
-
177
-
178
-
179
-
180
-
181
-
182
-
183
-
184
-
185
-
186
-
187
-
188
-
189
-
190
-
191
-
192
-
193
-
194
-
195
-
196
-
197
-
198
-
199
-
200
-
201
-
202
-
203
-
204
-
205
-
206
-
207
-
208
-
209
-
210
-
211
-
212
-
213
-
214
-
215
-
216
-
217
-
218
-
219
-
220
-
221
-
222
-
223
-
224
-
225
-
226
-
227
-
228
-
229
-
230
-
231
-
232
-
233
-
234
-
235
-
236
-
237
-
238
-
239
-
240
-
241
-
 242
242 -
 243
243 -
 244
244 -
 245
245 -
 246
246 -
 247
247 -
 248
248 -
 249
249 -
 250
250 -
 251
251 -
 252
252 -
 253
253 -
 254
254 -
 255
255 -
 256
256 -
 257
257 -
 258
258 -
 259
259 -
 260
260 -
 261
261 -
 262
262 -
263
-
264
-
265
-
266
-
267
-
268
-
269
-
270
-
271
-
272
-
273
-
274
-
275
-
276
-
277
-
278
-
279
-
280
-
281
-
282
-
283
-
284
-
285
-
286
-
287
-
288
-
289
-
290
-
291
-
292
-
293
-
294
-
295
-
296
-
297
-
298
-
299
-
300
 |
 |

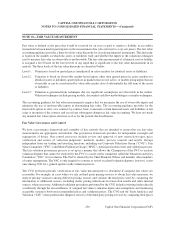
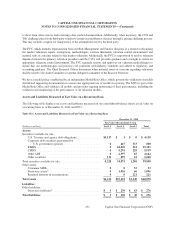
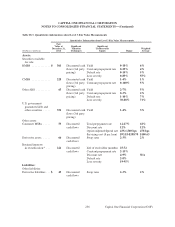
NOTE 18—FAIR VALUE MEASUREMENT
Fair value is defined as the price that would be received for an asset or paid to transfer a liability in an orderly
transaction between market participants on the measurement date (also referred to as an exit price). The fair value
accounting guidance provides a three-level fair value hierarchy for classifying financial instruments. This hierarchy
is based on the markets in which the assets or liabilities trade and whether the inputs to the valuation techniques
used to measure fair value are observable or unobservable. The fair value measurement of a financial asset or liability
is assigned a level based on the lowest level of any input that is significant to the fair value measurement in its
entirety. The three levels of the fair value hierarchy are described below:
Level 1: Valuation is based on quoted prices (unadjusted) in active markets for identical assets or liabilities.
Level 2: Valuation is based on observable market-based inputs, other than quoted prices in active markets for
identical assets or liabilities, quoted prices in markets that are not active, or models using inputs that are
observable or can be corroborated by observable market data of substantially the full term of the assets
or liabilities.
Level 3: Valuation is generated from techniques that use significant assumptions not observable in the market.
Valuation techniques include pricing models, discounted cash flow methodologies or similar techniques.
The accounting guidance for fair value measurements requires that we maximize the use of observable inputs and
minimize the use of unobservable inputs in determining fair value. The accounting guidance provides for the
irrevocable option to elect, on a contract-by-contract basis, to measure certain financial assets and liabilities at fair
value at inception of the contract and record any subsequent changes in fair value in earnings. We have not made
any material fair value option elections as of or for the periods disclosed herein.
Fair Value Governance and Control
We have a governance framework and a number of key controls that are intended to ensure that our fair value
measurements are appropriate and reliable. Our governance framework provides for independent oversight and
segregation of duties. Our control processes include review and approval of new transaction types, price
verification and review of valuation judgments, methods, models, process controls and results. Groups
independent from our trading and investing functions, including our Corporate Valuations Group (“CVG”), Fair
Value Committee (“FVC”) and Model Validation Group (“MVG”), participate in the review and validation process.
The fair valuation governance process is set up in a manner that allows the Chairperson of the FVC to escalate
valuation disputes that cannot be resolved by the FVC to a more senior committee called the Valuations Advisory
Committee (“VAC”) for resolution. The VAC is chaired by the Chief Financial Officer and includes other members
of senior management. The VAC is only required to convene to review escalated valuation disputes; however, it met
once during 2014 for a general update on the valuation process.
The CVG performs periodic verification of fair value measurements to determine if assigned fair values are
reasonable. For example, in cases where we rely on third-party pricing services to obtain fair value measures, we
analyze pricing variances among different pricing sources and validate the final price used by comparing the
information to additional sources, including dealer pricing indications in transaction results and other internal
sources, where necessary. Additional validation procedures performed by the CVG include reviewing (either directly
or indirectly through the reasonableness of assigned fair values) valuation inputs and assumptions and monitoring
acceptable variances between recommended prices and validation prices. The CVG and the Trade Analytics and
Valuation (“TAV”) team perform due diligence reviews of the third-party pricing services by comparing their prices
230
CAPITAL ONE FINANCIAL CORPORATION
NOTES TO CONSOLIDATED FINANCIAL STATEMENTS—(Continued)
Capital One Financial Corporation (COF)