Capital One 2014 Annual Report Download - page 263
Download and view the complete annual report
Please find page 263 of the 2014 Capital One annual report below. You can navigate through the pages in the report by either clicking on the pages listed below, or by using the keyword search tool below to find specific information within the annual report.-
 1
1 -
2
-
3
-
4
-
5
-
6
-
7
-
8
-
9
-
10
-
11
-
12
-
13
-
14
-
15
-
16
-
17
-
18
-
19
-
20
-
21
-
22
-
23
-
24
-
25
-
26
-
27
-
28
-
29
-
30
-
31
-
32
-
33
-
34
-
35
-
36
-
37
-
38
-
39
-
40
-
41
-
42
-
43
-
44
-
45
-
46
-
47
-
48
-
49
-
50
-
51
-
52
-
53
-
54
-
55
-
56
-
57
-
58
-
59
-
60
-
61
-
62
-
63
-
64
-
65
-
66
-
67
-
68
-
69
-
70
-
71
-
72
-
73
-
74
-
75
-
76
-
77
-
78
-
79
-
80
-
81
-
82
-
83
-
84
-
85
-
86
-
87
-
88
-
89
-
90
-
91
-
92
-
93
-
94
-
95
-
96
-
97
-
98
-
99
-
100
-
101
-
102
-
103
-
104
-
105
-
106
-
107
-
108
-
109
-
110
-
111
-
112
-
113
-
114
-
115
-
116
-
117
-
118
-
119
-
120
-
121
-
122
-
123
-
124
-
125
-
126
-
127
-
128
-
129
-
130
-
131
-
132
-
133
-
134
-
135
-
136
-
137
-
138
-
139
-
140
-
141
-
142
-
143
-
144
-
145
-
146
-
147
-
148
-
149
-
150
-
151
-
152
-
153
-
154
-
155
-
156
-
157
-
158
-
159
-
160
-
161
-
162
-
163
-
164
-
165
-
166
-
167
-
168
-
169
-
170
-
171
-
172
-
173
-
174
-
175
-
176
-
177
-
178
-
179
-
180
-
181
-
182
-
183
-
184
-
185
-
186
-
187
-
188
-
189
-
190
-
191
-
192
-
193
-
194
-
195
-
196
-
197
-
198
-
199
-
200
-
201
-
202
-
203
-
204
-
205
-
206
-
207
-
208
-
209
-
210
-
211
-
212
-
213
-
214
-
215
-
216
-
217
-
218
-
219
-
220
-
221
-
222
-
223
-
224
-
225
-
226
-
227
-
228
-
229
-
230
-
231
-
232
-
233
-
234
-
235
-
236
-
237
-
238
-
239
-
240
-
241
-
242
-
243
-
244
-
245
-
246
-
247
-
248
-
249
-
250
-
251
-
252
-
 253
253 -
 254
254 -
 255
255 -
 256
256 -
 257
257 -
 258
258 -
 259
259 -
 260
260 -
 261
261 -
 262
262 -
 263
263 -
 264
264 -
 265
265 -
 266
266 -
 267
267 -
 268
268 -
 269
269 -
 270
270 -
 271
271 -
 272
272 -
 273
273 -
274
-
275
-
276
-
277
-
278
-
279
-
280
-
281
-
282
-
283
-
284
-
285
-
286
-
287
-
288
-
289
-
290
-
291
-
292
-
293
-
294
-
295
-
296
-
297
-
298
-
299
-
300
 |
 |
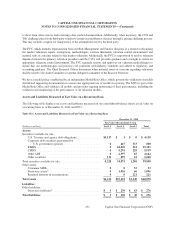
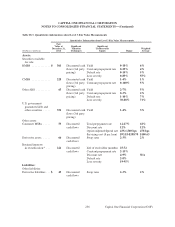
Investment Securities
Quoted prices in active markets are used to measure the fair value of U.S. Treasury debt obligations. For other investment
categories, we utilize multiple third-party pricing services to obtain fair value measurements for the large majority of
our securities. A pricing service may be considered as the primary pricing provider for certain types of securities, and
the designation of the primary pricing provider may vary depending on the type of securities. The determination of the
primary pricing provider is based on our experience and validation benchmark of the pricing service’s performance in
terms of providing fair value measurements for the various types of securities.
Certain securities are classified as Level 2 and 3, the majority of which are collateralized mortgage obligations and
mortgage-backed securities. Level 2 and 3 classifications indicate that significant valuation assumptions are not
consistently observable in the market. When significant assumptions are not consistently observable, fair values are
derived using the best available data. Such data may include quotes provided by a dealer, the use of external pricing
services, independent pricing models, or other model-based valuation techniques such as calculation of the present values
of future cash flows incorporating assumptions such as benchmark yields, spreads, prepayment speeds, credit ratings
and losses. The techniques used by the pricing services utilize observable market data to the extent available. Pricing
models may be used, which can vary by asset class and may incorporate available trade, bid and other market information.
Across asset classes, information such as trader/dealer input, credit spreads, forward curves and prepayment speeds are
used to help determine appropriate valuations. Because many fixed income securities do not trade on a daily basis, the
evaluated pricing applications may apply available information through processes such as benchmarking curves, like
securities, sector groupings and matrix pricing to prepare valuations. In addition, model processes are used by the pricing
services to develop prepayment and interest rate scenarios.
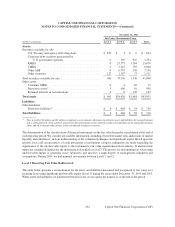
We validate the pricing obtained from the primary pricing providers through comparison of pricing to additional
sources, including other pricing services, dealer pricing indications in transaction results and other internal sources.
Pricing variances among different pricing sources are analyzed and validated. Additionally, on an on-going basis,
we may select a sample of securities and test the third-party valuation by obtaining more detailed information about
the pricing methodology, sources of information and assumptions used to value the securities.
The significant unobservable inputs used in the fair value measurement of our residential, asset-backed and
commercial securities include yield, prepayment rate, default rate and loss severity in the event of default. Significant
increases or decreases in any of those inputs in isolation or combination would result in a significant change in fair
value measurement. Generally, an increase in the yield assumption will result in a decrease in fair value measurement;
however, an increase or decrease in prepayment rate, default rate or loss severity may have a different impact on the
fair value given various characteristics of the security including the capital structure of the deal, credit enhancement
for the security or other factors.
Net Loans Held For Investment
Loans held for investment that are individually impaired are carried at the lower of cost or fair value of the underlying
collateral, less the estimated cost to sell. The fair values of credit card loans, installment loans, auto loans, home loans
and commercial loans are estimated using a discounted cash flow method, which is a form of the income approach.
Discount rates are determined considering rates at which similar portfolios of loans would be made under current
conditions and considering liquidity spreads applicable to each loan portfolio based on the secondary market. The fair
value of credit card loans excludes any value related to customer account relationships. For those loans held for
investment that are recorded at fair value on our consolidated balance sheets on a nonrecurring basis, the fair value is
determined using appraisal values that are obtained from independent appraisers, broker pricing opinions or other
available market information, adjusted for the estimated costs to transact the sale.
241
CAPITAL ONE FINANCIAL CORPORATION
NOTES TO CONSOLIDATED FINANCIAL STATEMENTS—(Continued)
Capital One Financial Corporation (COF)