Capital One 2014 Annual Report Download - page 261
Download and view the complete annual report
Please find page 261 of the 2014 Capital One annual report below. You can navigate through the pages in the report by either clicking on the pages listed below, or by using the keyword search tool below to find specific information within the annual report.-
 1
1 -
2
-
3
-
4
-
5
-
6
-
7
-
8
-
9
-
10
-
11
-
12
-
13
-
14
-
15
-
16
-
17
-
18
-
19
-
20
-
21
-
22
-
23
-
24
-
25
-
26
-
27
-
28
-
29
-
30
-
31
-
32
-
33
-
34
-
35
-
36
-
37
-
38
-
39
-
40
-
41
-
42
-
43
-
44
-
45
-
46
-
47
-
48
-
49
-
50
-
51
-
52
-
53
-
54
-
55
-
56
-
57
-
58
-
59
-
60
-
61
-
62
-
63
-
64
-
65
-
66
-
67
-
68
-
69
-
70
-
71
-
72
-
73
-
74
-
75
-
76
-
77
-
78
-
79
-
80
-
81
-
82
-
83
-
84
-
85
-
86
-
87
-
88
-
89
-
90
-
91
-
92
-
93
-
94
-
95
-
96
-
97
-
98
-
99
-
100
-
101
-
102
-
103
-
104
-
105
-
106
-
107
-
108
-
109
-
110
-
111
-
112
-
113
-
114
-
115
-
116
-
117
-
118
-
119
-
120
-
121
-
122
-
123
-
124
-
125
-
126
-
127
-
128
-
129
-
130
-
131
-
132
-
133
-
134
-
135
-
136
-
137
-
138
-
139
-
140
-
141
-
142
-
143
-
144
-
145
-
146
-
147
-
148
-
149
-
150
-
151
-
152
-
153
-
154
-
155
-
156
-
157
-
158
-
159
-
160
-
161
-
162
-
163
-
164
-
165
-
166
-
167
-
168
-
169
-
170
-
171
-
172
-
173
-
174
-
175
-
176
-
177
-
178
-
179
-
180
-
181
-
182
-
183
-
184
-
185
-
186
-
187
-
188
-
189
-
190
-
191
-
192
-
193
-
194
-
195
-
196
-
197
-
198
-
199
-
200
-
201
-
202
-
203
-
204
-
205
-
206
-
207
-
208
-
209
-
210
-
211
-
212
-
213
-
214
-
215
-
216
-
217
-
218
-
219
-
220
-
221
-
222
-
223
-
224
-
225
-
226
-
227
-
228
-
229
-
230
-
231
-
232
-
233
-
234
-
235
-
236
-
237
-
238
-
239
-
240
-
241
-
242
-
243
-
244
-
245
-
246
-
247
-
248
-
249
-
250
-
 251
251 -
 252
252 -
 253
253 -
 254
254 -
 255
255 -
 256
256 -
 257
257 -
 258
258 -
 259
259 -
 260
260 -
 261
261 -
 262
262 -
 263
263 -
 264
264 -
 265
265 -
 266
266 -
 267
267 -
 268
268 -
 269
269 -
 270
270 -
 271
271 -
272
-
273
-
274
-
275
-
276
-
277
-
278
-
279
-
280
-
281
-
282
-
283
-
284
-
285
-
286
-
287
-
288
-
289
-
290
-
291
-
292
-
293
-
294
-
295
-
296
-
297
-
298
-
299
-
300
 |
 |

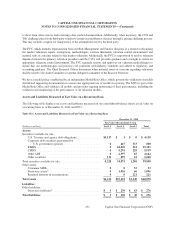
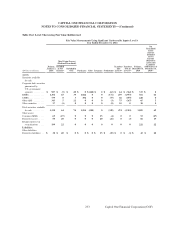
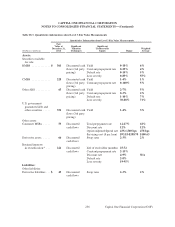
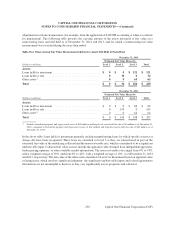
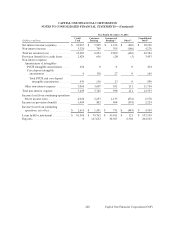
The following table presents total nonrecurring fair value measurements for the period, included in earnings,
attributable to the change in fair value relating to assets that are still held at December 31, 2014 and 2013:
Table 18.5: Nonrecurring Fair Value Measurements Included in Earnings Related to Assets Still Held at Period End
Total Gains (Losses)
Year Ended December 31,
(Dollars in millions) 2014 2013
Assets:
Loans held for investment . . . . . . . . . . . . . . . . . . . . . . . . . . . . . . . . . . . . . . . . . . . . . . . . . . $ (24) $ (28)
Loans held for sale . . . . . . . . . . . . . . . . . . . . . . . . . . . . . . . . . . . . . . . . . . . . . . . . . . . . . . . . 0(1)
Other assets(1) . . . . . . . . . . . . . . . . . . . . . . . . . . . . . . . . . . . . . . . . . . . . . . . . . . . . . . . . . . . . (12) (23)
Total . . . . . . . . . . . . . . . . . . . . . . . . . . . . . . . . . . . . . . . . . . . . . . . . . . . . . . . . . . . . . . . . . . . $ (36) $ (52)
(1) Includes losses related to foreclosed property and repossessed assets and long-lived assets held for sale.
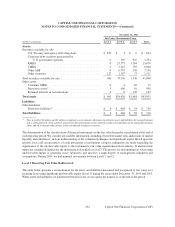
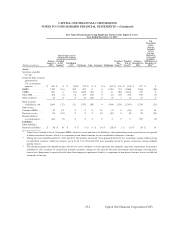
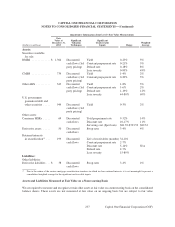
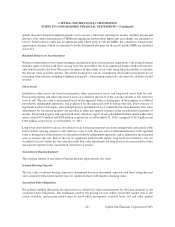
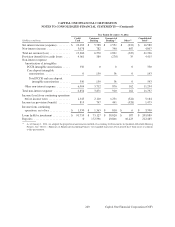
Fair Value of Financial Instruments
The following table presents the fair value of financial instruments, whether or not recognized on the consolidated
balance sheets at fair value, as of December 31, 2014 and 2013:
Table 18.6: Fair Value of Financial Instruments
December 31, 2014 Estimated Fair Value Hierarchy
Carrying Estimated
(Dollars in millions) Amount Fair Value Level 1 Level 2 Level 3
Financial assets:
Cash and cash equivalents . . . . . . . . . . . . . . . . . . . . . . $ 7,242 $ 7,242 $ 7,242 $ 0 $ 0
Restricted cash for securitization investors . . . . . . . . . 234 234 234 0 0
Securities available for sale . . . . . . . . . . . . . . . . . . . . . 39,508 39,508 4,228 34,075 1,205
Securities held to maturity . . . . . . . . . . . . . . . . . . . . . . 22,500 23,634 0 23,503 131
Net loans held for investment . . . . . . . . . . . . . . . . . . . . 203,933 207,104 0 0 207,104
Loans held for sale . . . . . . . . . . . . . . . . . . . . . . . . . . . . 626 650 0 650 0
Interest receivable . . . . . . . . . . . . . . . . . . . . . . . . . . . . . 1,435 1,435 0 1,435 0
Derivative assets . . . . . . . . . . . . . . . . . . . . . . . . . . . . . . 1,096 1,096 4 1,026 66
Retained interests in securitizations . . . . . . . . . . . . . . . 221 221 0 0 221
Financial liabilities:
Non-interest bearing deposits . . . . . . . . . . . . . . . . . . . . $ 25,081 $ 25,081 $ 25,081 $ 0 $ 0
Interest-bearing deposits . . . . . . . . . . . . . . . . . . . . . . . . 180,467 174,074 0 11,668 162,406
Securitized debt obligations . . . . . . . . . . . . . . . . . . . . . 11,624 11,745 0 11,745 0
Senior and subordinated notes . . . . . . . . . . . . . . . . . . . 18,684 19,083 0 19,083 0
Federal funds purchased and securities loaned
or sold under agreements to repurchase . . . . . . . . . . 880 880 880 0 0
Other borrowings . . . . . . . . . . . . . . . . . . . . . . . . . . . . . 17,269 17,275 0 17,275 0
Interest payable . . . . . . . . . . . . . . . . . . . . . . . . . . . . . . . 317 317 0 317 0
Derivative liabilities . . . . . . . . . . . . . . . . . . . . . . . . . . . 276 276 3 230 43
239
CAPITAL ONE FINANCIAL CORPORATION
NOTES TO CONSOLIDATED FINANCIAL STATEMENTS—(Continued)
Capital One Financial Corporation (COF)