Capital One 2014 Annual Report Download - page 286
Download and view the complete annual report
Please find page 286 of the 2014 Capital One annual report below. You can navigate through the pages in the report by either clicking on the pages listed below, or by using the keyword search tool below to find specific information within the annual report.-
 1
1 -
2
-
3
-
4
-
5
-
6
-
7
-
8
-
9
-
10
-
11
-
12
-
13
-
14
-
15
-
16
-
17
-
18
-
19
-
20
-
21
-
22
-
23
-
24
-
25
-
26
-
27
-
28
-
29
-
30
-
31
-
32
-
33
-
34
-
35
-
36
-
37
-
38
-
39
-
40
-
41
-
42
-
43
-
44
-
45
-
46
-
47
-
48
-
49
-
50
-
51
-
52
-
53
-
54
-
55
-
56
-
57
-
58
-
59
-
60
-
61
-
62
-
63
-
64
-
65
-
66
-
67
-
68
-
69
-
70
-
71
-
72
-
73
-
74
-
75
-
76
-
77
-
78
-
79
-
80
-
81
-
82
-
83
-
84
-
85
-
86
-
87
-
88
-
89
-
90
-
91
-
92
-
93
-
94
-
95
-
96
-
97
-
98
-
99
-
100
-
101
-
102
-
103
-
104
-
105
-
106
-
107
-
108
-
109
-
110
-
111
-
112
-
113
-
114
-
115
-
116
-
117
-
118
-
119
-
120
-
121
-
122
-
123
-
124
-
125
-
126
-
127
-
128
-
129
-
130
-
131
-
132
-
133
-
134
-
135
-
136
-
137
-
138
-
139
-
140
-
141
-
142
-
143
-
144
-
145
-
146
-
147
-
148
-
149
-
150
-
151
-
152
-
153
-
154
-
155
-
156
-
157
-
158
-
159
-
160
-
161
-
162
-
163
-
164
-
165
-
166
-
167
-
168
-
169
-
170
-
171
-
172
-
173
-
174
-
175
-
176
-
177
-
178
-
179
-
180
-
181
-
182
-
183
-
184
-
185
-
186
-
187
-
188
-
189
-
190
-
191
-
192
-
193
-
194
-
195
-
196
-
197
-
198
-
199
-
200
-
201
-
202
-
203
-
204
-
205
-
206
-
207
-
208
-
209
-
210
-
211
-
212
-
213
-
214
-
215
-
216
-
217
-
218
-
219
-
220
-
221
-
222
-
223
-
224
-
225
-
226
-
227
-
228
-
229
-
230
-
231
-
232
-
233
-
234
-
235
-
236
-
237
-
238
-
239
-
240
-
241
-
242
-
243
-
244
-
245
-
246
-
247
-
248
-
249
-
250
-
251
-
252
-
253
-
254
-
255
-
256
-
257
-
258
-
259
-
260
-
261
-
262
-
263
-
264
-
265
-
266
-
267
-
268
-
269
-
270
-
271
-
272
-
273
-
274
-
275
-
 276
276 -
 277
277 -
 278
278 -
 279
279 -
 280
280 -
 281
281 -
 282
282 -
 283
283 -
 284
284 -
 285
285 -
 286
286 -
 287
287 -
 288
288 -
 289
289 -
 290
290 -
 291
291 -
 292
292 -
 293
293 -
 294
294 -
 295
295 -
 296
296 -
297
-
298
-
299
-
300
 |
 |

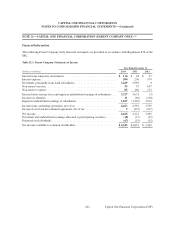
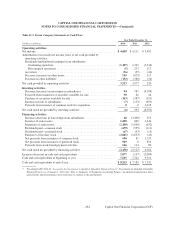
Table 21.3: Parent Company Statements of Cash Flows
Year Ended December 31,
(Dollars in millions) 2014 2013 2012
Operating activities:
Net income . . . . . . . . . . . . . . . . . . . . . . . . . . . . . . . . . . . . . . . . . . . . . . . . . . . . . . . . $ 4,428 $ 4,121 $ 3,492
Adjustments to reconcile net income (loss) to net cash provided by
operating activities:
Dividends (undistributed earnings) from subsidiaries:
Continuing operations . . . . . . . . . . . . . . . . . . . . . . . . . . . . . . . . . . . . . . . . . . . (1,107) 1,343 (3,544)
Discontinued operations . . . . . . . . . . . . . . . . . . . . . . . . . . . . . . . . . . . . . . . . . . (5) 233 217
Accretion . . . . . . . . . . . . . . . . . . . . . . . . . . . . . . . . . . . . . . . . . . . . . . . . . . . . . . . (76) (57) (24)
Decrease (increase) in other assets . . . . . . . . . . . . . . . . . . . . . . . . . . . . . . . . . . . . 145 (675) 113
Decrease in other liabilities . . . . . . . . . . . . . . . . . . . . . . . . . . . . . . . . . . . . . . . . . (152) (388) (34)
Net cash provided by operating activities . . . . . . . . . . . . . . . . . . . . . . . . . . . . . . . . 3,233 4,577 220
Investing activities:
Decrease (increase) in investment in subsidiaries . . . . . . . . . . . . . . . . . . . . . . . . 94 787 (9,709)
Proceeds from maturities of securities available for sale . . . . . . . . . . . . . . . . . . . 50 46 24
Purchase of securities available for sale . . . . . . . . . . . . . . . . . . . . . . . . . . . . . . . . (143) (287) (351)
Increase in loans to subsidiaries . . . . . . . . . . . . . . . . . . . . . . . . . . . . . . . . . . . . . . (7) (153) (997)
Proceeds from issuance of common stock for acquisition . . . . . . . . . . . . . . . . . . 00 2,638
Net cash (used in) provided by investing activities . . . . . . . . . . . . . . . . . . . . . . . . . (6) 393 (8,395)
Financing activities:
Increase (decrease) in borrowings from subsidiaries . . . . . . . . . . . . . . . . . . . . . . 28 (3,490) 555
Issuance of senior notes . . . . . . . . . . . . . . . . . . . . . . . . . . . . . . . . . . . . . . . . . . . . 1,498 849 2,246
Maturities of senior notes . . . . . . . . . . . . . . . . . . . . . . . . . . . . . . . . . . . . . . . . . . . (2,100) (1,040) (632)
Dividends paid—common stock . . . . . . . . . . . . . . . . . . . . . . . . . . . . . . . . . . . . . (679) (555) (111)
Dividends paid—preferred stock . . . . . . . . . . . . . . . . . . . . . . . . . . . . . . . . . . . . . (67) (53) (15)
Purchases of treasury stock . . . . . . . . . . . . . . . . . . . . . . . . . . . . . . . . . . . . . . . . . (2,045) (1,033) (43)
Net proceeds from issuances of common stock . . . . . . . . . . . . . . . . . . . . . . . . . . 100 81 3,233
Net proceeds from issuances of preferred stock . . . . . . . . . . . . . . . . . . . . . . . . . . 969 0 853
Proceeds from stock-based payment activities . . . . . . . . . . . . . . . . . . . . . . . . . . . 146 114 80
Net cash (used in) provided by financing activities . . . . . . . . . . . . . . . . . . . . . . . . . (2,150) (5,127) 6,166
Increase (decrease) in cash and cash equivalents . . . . . . . . . . . . . . . . . . . . . . . . . . . 1,077 (157) (2,009)
Cash and cash equivalents at beginning of year . . . . . . . . . . . . . . . . . . . . . . . . . . . . 7,185 7,342 9,351
Cash and cash equivalents at end of year . . . . . . . . . . . . . . . . . . . . . . . . . . . . . . . . . $ 8,262 $ 7,185 $ 7,342
(1) We adopted ASU 2014-01 “Accounting for Investments in Qualified Affordable Housing Projects” (Investments in Qualified Affordable
Housing Projects) as of January 1, 2014. See “Note 1—Summary of Significant Accounting Policies” for additional information. Prior
period results and related metrics have been recast to conform to this presentation.
264
CAPITAL ONE FINANCIAL CORPORATION
NOTES TO CONSOLIDATED FINANCIAL STATEMENTS—(Continued)
Capital One Financial Corporation (COF)