Capital One 2014 Annual Report Download - page 237
Download and view the complete annual report
Please find page 237 of the 2014 Capital One annual report below. You can navigate through the pages in the report by either clicking on the pages listed below, or by using the keyword search tool below to find specific information within the annual report.-
 1
1 -
2
-
3
-
4
-
5
-
6
-
7
-
8
-
9
-
10
-
11
-
12
-
13
-
14
-
15
-
16
-
17
-
18
-
19
-
20
-
21
-
22
-
23
-
24
-
25
-
26
-
27
-
28
-
29
-
30
-
31
-
32
-
33
-
34
-
35
-
36
-
37
-
38
-
39
-
40
-
41
-
42
-
43
-
44
-
45
-
46
-
47
-
48
-
49
-
50
-
51
-
52
-
53
-
54
-
55
-
56
-
57
-
58
-
59
-
60
-
61
-
62
-
63
-
64
-
65
-
66
-
67
-
68
-
69
-
70
-
71
-
72
-
73
-
74
-
75
-
76
-
77
-
78
-
79
-
80
-
81
-
82
-
83
-
84
-
85
-
86
-
87
-
88
-
89
-
90
-
91
-
92
-
93
-
94
-
95
-
96
-
97
-
98
-
99
-
100
-
101
-
102
-
103
-
104
-
105
-
106
-
107
-
108
-
109
-
110
-
111
-
112
-
113
-
114
-
115
-
116
-
117
-
118
-
119
-
120
-
121
-
122
-
123
-
124
-
125
-
126
-
127
-
128
-
129
-
130
-
131
-
132
-
133
-
134
-
135
-
136
-
137
-
138
-
139
-
140
-
141
-
142
-
143
-
144
-
145
-
146
-
147
-
148
-
149
-
150
-
151
-
152
-
153
-
154
-
155
-
156
-
157
-
158
-
159
-
160
-
161
-
162
-
163
-
164
-
165
-
166
-
167
-
168
-
169
-
170
-
171
-
172
-
173
-
174
-
175
-
176
-
177
-
178
-
179
-
180
-
181
-
182
-
183
-
184
-
185
-
186
-
187
-
188
-
189
-
190
-
191
-
192
-
193
-
194
-
195
-
196
-
197
-
198
-
199
-
200
-
201
-
202
-
203
-
204
-
205
-
206
-
207
-
208
-
209
-
210
-
211
-
212
-
213
-
214
-
215
-
216
-
217
-
218
-
219
-
220
-
221
-
222
-
223
-
224
-
225
-
226
-
 227
227 -
 228
228 -
 229
229 -
 230
230 -
 231
231 -
 232
232 -
 233
233 -
 234
234 -
 235
235 -
 236
236 -
 237
237 -
 238
238 -
 239
239 -
 240
240 -
 241
241 -
 242
242 -
 243
243 -
 244
244 -
 245
245 -
 246
246 -
 247
247 -
248
-
249
-
250
-
251
-
252
-
253
-
254
-
255
-
256
-
257
-
258
-
259
-
260
-
261
-
262
-
263
-
264
-
265
-
266
-
267
-
268
-
269
-
270
-
271
-
272
-
273
-
274
-
275
-
276
-
277
-
278
-
279
-
280
-
281
-
282
-
283
-
284
-
285
-
286
-
287
-
288
-
289
-
290
-
291
-
292
-
293
-
294
-
295
-
296
-
297
-
298
-
299
-
300
 |
 |

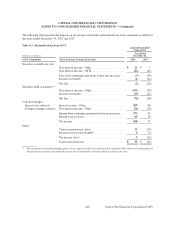
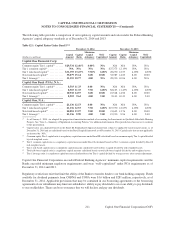
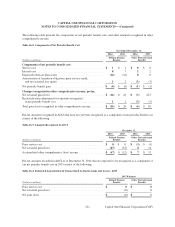
million, and $36 million, respectively. The unrecognized compensation expense related to stock options as of
December 31, 2014 was $5 million, which is expected to be amortized over a weighted-average period of 1.5 years. The
following table sets forth the cash received from the exercise of stock options under all stock-based incentive
arrangements, and the actual income tax benefit realized related to tax deductions from the exercise of the stock options.
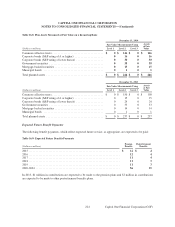
Table 15.2: Stock Options Cash Flow Impact
Year Ended December 31,
(Dollars in millions) 2014 2013 2012
Cash received for options exercised . . . . . . . . . . . . . . . . . . . . . . . . . . . . . . . . . . . . $ 131 $ 105 $ 66
Tax benefit realized for options exercised . . . . . . . . . . . . . . . . . . . . . . . . . . . . . . . . 918 14
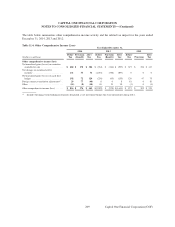
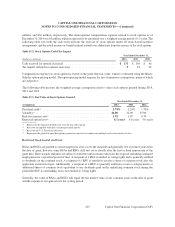
Compensation expense for stock options is based on the grant date fair value, which is estimated using the Black-
Scholes option-pricing model. The option pricing model requires the use of numerous assumptions, many of which
are subjective.
The following table presents the weighted-average assumptions used to value stock options granted during 2014,
2013 and 2012.
Table 15.3: Fair Value of Stock Options Granted
Year Ended December 31,
Assumptions 2014 2013 2012
Dividend yield(1) . . . . . . . . . . . . . . . . . . . . . . . . . . . . . . . . . . . . . . . . . . . . . . . 1.74% 2.29% 1.70%
Volatility(2) . . . . . . . . . . . . . . . . . . . . . . . . . . . . . . . . . . . . . . . . . . . . . . . . . . . . 26.00 32.00 35.00
Risk-free interest rate(3) . . . . . . . . . . . . . . . . . . . . . . . . . . . . . . . . . . . . . . . . . . 1.92 1.07 0.74
Expected option lives(4) . . . . . . . . . . . . . . . . . . . . . . . . . . . . . . . . . . . . . . . . . . 6.1 years 5.6 years 5.0 years
(1) Represents the expected dividend rate over the life of the option.
(2) Based on the implied volatility of exchange-traded options.
(3) Based on the U.S. Treasury yield curve.
(4) Represents the period of time that options granted are expected to remain outstanding based on historical activities.
Restricted Stock Awards and Units
RSAs and RSUs are granted to certain employees at no cost to the recipient and generally vest over three years from
the date of grant, however some RSAs and RSUs cliff vest on or shortly after the first or third anniversary of the
grant date. These awards and units are subject to forfeiture until certain restrictions have lapsed, including continued
employment for a specified period of time. A recipient of a RSA is entitled to voting rights and is generally entitled
to dividends on the common stock. A recipient of a RSU is entitled to receive a share of common stock after the
applicable restrictions lapse. Additionally, a recipient of a RSU is generally entitled to receive cash payments or
additional shares of common stock equivalent to any dividends paid on the underlying common stock during the
period the RSU is outstanding, but is not entitled to voting rights.
Generally, the value of RSAs and RSUs will equal the fair market value of our common stock on the date of grant
and the expense is recognized over the vesting period.
215
CAPITAL ONE FINANCIAL CORPORATION
NOTES TO CONSOLIDATED FINANCIAL STATEMENTS—(Continued)
Capital One Financial Corporation (COF)