Capital One 2014 Annual Report Download - page 59
Download and view the complete annual report
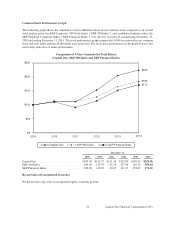
Please find page 59 of the 2014 Capital One annual report below. You can navigate through the pages in the report by either clicking on the pages listed below, or by using the keyword search tool below to find specific information within the annual report.-
 1
1 -
2
-
3
-
4
-
5
-
6
-
7
-
8
-
9
-
10
-
11
-
12
-
13
-
14
-
15
-
16
-
17
-
18
-
19
-
20
-
21
-
22
-
23
-
24
-
25
-
26
-
27
-
28
-
29
-
30
-
31
-
32
-
33
-
34
-
35
-
36
-
37
-
38
-
39
-
40
-
41
-
42
-
43
-
44
-
45
-
46
-
47
-
48
-
 49
49 -
 50
50 -
 51
51 -
 52
52 -
 53
53 -
 54
54 -
 55
55 -
 56
56 -
 57
57 -
 58
58 -
 59
59 -
 60
60 -
 61
61 -
 62
62 -
 63
63 -
 64
64 -
 65
65 -
 66
66 -
 67
67 -
 68
68 -
 69
69 -
70
-
71
-
72
-
73
-
74
-
75
-
76
-
77
-
78
-
79
-
80
-
81
-
82
-
83
-
84
-
85
-
86
-
87
-
88
-
89
-
90
-
91
-
92
-
93
-
94
-
95
-
96
-
97
-
98
-
99
-
100
-
101
-
102
-
103
-
104
-
105
-
106
-
107
-
108
-
109
-
110
-
111
-
112
-
113
-
114
-
115
-
116
-
117
-
118
-
119
-
120
-
121
-
122
-
123
-
124
-
125
-
126
-
127
-
128
-
129
-
130
-
131
-
132
-
133
-
134
-
135
-
136
-
137
-
138
-
139
-
140
-
141
-
142
-
143
-
144
-
145
-
146
-
147
-
148
-
149
-
150
-
151
-
152
-
153
-
154
-
155
-
156
-
157
-
158
-
159
-
160
-
161
-
162
-
163
-
164
-
165
-
166
-
167
-
168
-
169
-
170
-
171
-
172
-
173
-
174
-
175
-
176
-
177
-
178
-
179
-
180
-
181
-
182
-
183
-
184
-
185
-
186
-
187
-
188
-
189
-
190
-
191
-
192
-
193
-
194
-
195
-
196
-
197
-
198
-
199
-
200
-
201
-
202
-
203
-
204
-
205
-
206
-
207
-
208
-
209
-
210
-
211
-
212
-
213
-
214
-
215
-
216
-
217
-
218
-
219
-
220
-
221
-
222
-
223
-
224
-
225
-
226
-
227
-
228
-
229
-
230
-
231
-
232
-
233
-
234
-
235
-
236
-
237
-
238
-
239
-
240
-
241
-
242
-
243
-
244
-
245
-
246
-
247
-
248
-
249
-
250
-
251
-
252
-
253
-
254
-
255
-
256
-
257
-
258
-
259
-
260
-
261
-
262
-
263
-
264
-
265
-
266
-
267
-
268
-
269
-
270
-
271
-
272
-
273
-
274
-
275
-
276
-
277
-
278
-
279
-
280
-
281
-
282
-
283
-
284
-
285
-
286
-
287
-
288
-
289
-
290
-
291
-
292
-
293
-
294
-
295
-
296
-
297
-
298
-
299
-
300
 |
 |

Change
Year Ended December 31, 2014 vs. 2013 vs.
(Dollars in millions, except per share data and as noted) 2014 2013 2012 2011 2010 2013 2012
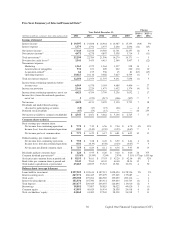
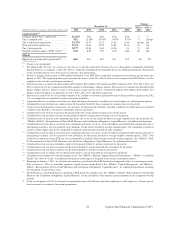
Selected performance metrics
Purchase volume(7) . . . . . . . . . . . . . . . . . . . . . . $224,750 $ 201,074 $ 180,599 $135,120 $ 106,912 12% 11%
Total net revenue margin(8) . . . . . . . . . . . . . . . 8.34% 8.40% 8.39% 9.29% 9.20% (6) bps 1 bps
Net interest margin(9) . . . . . . . . . . . . . . . . . . . . 6.67 6.80 6.50 7.27 7.09 (13) 30
Return on average assets . . . . . . . . . . . . . . . . . 1.48 1.46 1.29 1.62 1.52 2 17
Return on average tangible assets(10) . . . . . . . . 1.56 1.55 1.37 1.74 1.63 1 18
Return on average common equity(11) . . . . . . . 10.08 10.54 9.96 11.25 12.17 (46) 58
Return on average tangible common equity(12) 15.79 17.35 17.25 22.05 27.83 (156) 10
Equity-to-assets ratio(13) . . . . . . . . . . . . . . . . . . 14.84 13.95 13.00 14.29 12.45 89 95
Non-interest expense as a % of average loans
held for investment(14) . . . . . . . . . . . . . . . . . 6.15 6.41 6.28 7.19 6.11 (26) 13
Efficiency ratio(15) . . . . . . . . . . . . . . . . . . . . . . 54.64 55.19 55.14 56.70 48.59 (55) 5
Effective income tax rate from continuing
operations . . . . . . . . . . . . . . . . . . . . . . . . . . 32.67 33.81 28.45 30.97 31.18 (114) 536
Net charge-offs . . . . . . . . . . . . . . . . . . . . . . . . $ 3,414 $ 3,934 $ 3,555 $ 3,771 $ 6,651 (13)% 11%
Net charge-off rate(16) . . . . . . . . . . . . . . . . . . . . 1.72% 2.04% 1.89% 2.94% 5.18% (32) bps 15 bps
Net charge-off rate
(excluding Acquired Loans)(17) . . . . . . . . . . 1.98 2.45 2.34 3.06 5.45 (47) 11
Change
December 31, 2014 vs. 2013 vs.
(Dollars in millions, except per share data as noted) 2014 2013 2012 2011 2010 2013 2012
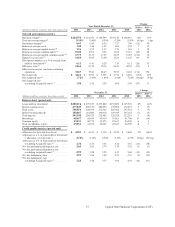
Balance sheet (period end)
Loans held for investment . . . . . . . . . . . . . . . . $208,316 $ 197,199 $ 205,889 $135,892 $ 125,947 6% (4)%
Interest-earning assets . . . . . . . . . . . . . . . . . . . 277,849 265,170 280,096 179,878 172,071 5 (5)
Total assets . . . . . . . . . . . . . . . . . . . . . . . . . . . 308,854 296,933 312,942 205,962 197,522 4 (5)
Interest-bearing deposits . . . . . . . . . . . . . . . . . 180,467 181,880 190,018 109,945 107,162 (1) (4)
Total deposits . . . . . . . . . . . . . . . . . . . . . . . . . . 205,548 204,523 212,485 128,226 122,210 1 (4)
Borrowings . . . . . . . . . . . . . . . . . . . . . . . . . . . 48,457 40,654 49,910 39,561 41,796 19 (19)
Common equity . . . . . . . . . . . . . . . . . . . . . . . . 43,231 40,779 39,572 29,617 26,509 6 3
Total stockholders’ equity . . . . . . . . . . . . . . . . 45,053 41,632 40,425 29,617 26,509 8 3
Credit quality metrics (period end)
Allowance for loan and lease losses . . . . . . . . $ 4,383 $ 4,315 $ 5,156 $ 4,250 $ 5,628 2% (16)%
Allowance as a % of loans held for investment
(“allowance coverage ratio”) . . . . . . . . . . . . 2.10% 2.19% 2.50% 3.13% 4.47% (9) bps (31) bps
Allowance as a % of loans held for investment
(excluding Acquired Loans)(17) . . . . . . . . . . 2.36 2.54 3.02 3.22 4.67 (18) (48)
30+ day performing delinquency rate . . . . . . . 2.62 2.63 2.70 3.35 3.52 (1) (7)
30+ day performing delinquency rate
(excluding Acquired Loans)(17) . . . . . . . . . . 2.95 3.08 3.29 3.47 3.68 (13) (21)
30+ day delinquency rate . . . . . . . . . . . . . . . . 2.91 2.96 3.09 3.95 4.23 (5) (13)
30+ day delinquency rate
(excluding Acquired Loans)(17) . . . . . . . . . . 3.28 3.46 3.77 4.09 4.43 (18) (31)
37 Capital One Financial Corporation (COF)