Capital One 2014 Annual Report Download - page 91
Download and view the complete annual report
Please find page 91 of the 2014 Capital One annual report below. You can navigate through the pages in the report by either clicking on the pages listed below, or by using the keyword search tool below to find specific information within the annual report.-
 1
1 -
2
-
3
-
4
-
5
-
6
-
7
-
8
-
9
-
10
-
11
-
12
-
13
-
14
-
15
-
16
-
17
-
18
-
19
-
20
-
21
-
22
-
23
-
24
-
25
-
26
-
27
-
28
-
29
-
30
-
31
-
32
-
33
-
34
-
35
-
36
-
37
-
38
-
39
-
40
-
41
-
42
-
43
-
44
-
45
-
46
-
47
-
48
-
49
-
50
-
51
-
52
-
53
-
54
-
55
-
56
-
57
-
58
-
59
-
60
-
61
-
62
-
63
-
64
-
65
-
66
-
67
-
68
-
69
-
70
-
71
-
72
-
73
-
74
-
75
-
76
-
77
-
78
-
79
-
80
-
 81
81 -
 82
82 -
 83
83 -
 84
84 -
 85
85 -
 86
86 -
 87
87 -
 88
88 -
 89
89 -
 90
90 -
 91
91 -
 92
92 -
 93
93 -
 94
94 -
 95
95 -
 96
96 -
 97
97 -
 98
98 -
 99
99 -
 100
100 -
 101
101 -
102
-
103
-
104
-
105
-
106
-
107
-
108
-
109
-
110
-
111
-
112
-
113
-
114
-
115
-
116
-
117
-
118
-
119
-
120
-
121
-
122
-
123
-
124
-
125
-
126
-
127
-
128
-
129
-
130
-
131
-
132
-
133
-
134
-
135
-
136
-
137
-
138
-
139
-
140
-
141
-
142
-
143
-
144
-
145
-
146
-
147
-
148
-
149
-
150
-
151
-
152
-
153
-
154
-
155
-
156
-
157
-
158
-
159
-
160
-
161
-
162
-
163
-
164
-
165
-
166
-
167
-
168
-
169
-
170
-
171
-
172
-
173
-
174
-
175
-
176
-
177
-
178
-
179
-
180
-
181
-
182
-
183
-
184
-
185
-
186
-
187
-
188
-
189
-
190
-
191
-
192
-
193
-
194
-
195
-
196
-
197
-
198
-
199
-
200
-
201
-
202
-
203
-
204
-
205
-
206
-
207
-
208
-
209
-
210
-
211
-
212
-
213
-
214
-
215
-
216
-
217
-
218
-
219
-
220
-
221
-
222
-
223
-
224
-
225
-
226
-
227
-
228
-
229
-
230
-
231
-
232
-
233
-
234
-
235
-
236
-
237
-
238
-
239
-
240
-
241
-
242
-
243
-
244
-
245
-
246
-
247
-
248
-
249
-
250
-
251
-
252
-
253
-
254
-
255
-
256
-
257
-
258
-
259
-
260
-
261
-
262
-
263
-
264
-
265
-
266
-
267
-
268
-
269
-
270
-
271
-
272
-
273
-
274
-
275
-
276
-
277
-
278
-
279
-
280
-
281
-
282
-
283
-
284
-
285
-
286
-
287
-
288
-
289
-
290
-
291
-
292
-
293
-
294
-
295
-
296
-
297
-
298
-
299
-
300
 |
 |

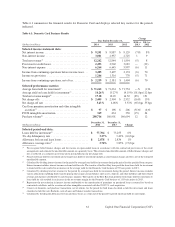
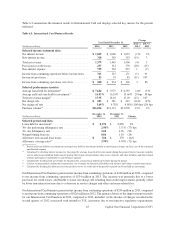
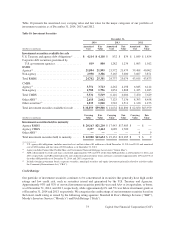
December 31, December 31,
(Dollars in millions) 2014 2013 Change
Selected period-end data:
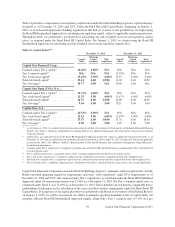
Loans held for investment:
Commercial and multifamily real estate . . . . . . . . . . . . . $ 23,137 $ 20,750 12%
Commercial and industrial
(4)
. . . . . . . . . . . . . . . . . . . . . . 26,972 23,309 16
Total commercial lending . . . . . . . . . . . . . . . . . . . . . . 50,109 44,059 14
Small-ticket commercial real estate . . . . . . . . . . . . . . . . 781 952 (18)
Total commercial banking
(4)
. . . . . . . . . . . . . . . . . . . . . . . . $ 50,890 $ 45,011 13
Nonperforming loans rate . . . . . . . . . . . . . . . . . . . . . . . . . . 0.34% 0.33% 1 bps
Nonperforming asset rate
(5)
. . . . . . . . . . . . . . . . . . . . . . . . 0.36 0.37 (1)
Allowance for loan and lease losses . . . . . . . . . . . . . . . . . . $ 395 $ 338 17%
Allowance coverage ratio
(6)
. . . . . . . . . . . . . . . . . . . . . . . . 0.78% 0.75% 3 bps
Deposits . . . . . . . . . . . . . . . . . . . . . . . . . . . . . . . . . . . . . . . $ 31,954 $ 30,567 5%
Loans serviced for others
(7)
. . . . . . . . . . . . . . . . . . . . . . . . .
14,131
10,786 31
** Change is not meaningful.
(1) As of January 1, 2014, we adopted the proportional amortization method of accounting for Investments in Qualified Affordable Housing
Projects. See “Note 1—Summary of Significant Accounting Policies” for additional information. Prior periods have been recast to conform
to this presentation.
(2) The average yield on loans held for investment is calculated by dividing interest income for the period by average loans held for investment
during the period. Interest income excludes various allocations including funds transfer pricing that assigns certain balance sheet assets,
deposits and other liabilities and their related revenue and expenses attributable to each business segment. Some of our tax-related commercial
investments generate tax-exempt income or tax credits. Accordingly, we make certain reclassifications within our Commercial Banking
business results to present revenues and yields on a taxable-equivalent basis, calculated assuming an effective tax rate approximately equal
to our federal statutory tax rate of 35%.
(3) Includes Acquired Loans with carrying value of $191 million and $262 million as of December 31, 2014 and 2013 respectively. The average
balance of commercial banking loans held for investment, excluding Acquired Loans, was $47.7 billion, $40.5 billion and $35.1 billion in
2014, 2013 and 2012, respectively.
(4) Includes $3.7 billion of loans to the oil and gas industry as of December 31, 2014.
(5) Calculated by dividing nonperforming assets as of the end of the period by the sum of period-end loans held for investment, foreclosed
properties, and other foreclosed assets.
(6) Calculated by dividing the allowance for loan and lease losses as of the end of the period by period-end loans held for investment.
(7) Represents our portfolio of loans serviced for third parties related to the Beech Street business.
Key factors affecting the results of our Commercial Banking business for 2014, compared to 2013, and changes in
financial condition and credit performance between December 31, 2014 and December 31, 2013 include the
following:
•Net Interest Income: Net interest income increased by $77 million, or 5%, to $1.8 billion in 2014, compared to
$1.7 billion in 2013. The increase was driven by growth in commercial and multifamily real estate and
commercial and industrial loans, partially offset by lower loan yields driven by market and competitive pressures.
•Non-Interest Income: Non-interest income increased by $55 million, or 14%, to $450 million in 2014, compared
to $395 million in 2013, primarily driven by increased revenue related to fee-based services and products
attributable to the Beech Street business.
•Provision for Credit Losses: The provision for credit losses increased by $117 million, to $93 million in 2014,
compared to a benefit of $24 million in 2013, primarily due to the change from an allowance release in 2013
driven by credit improvements, to an allowance build in 2014 attributable to loan growth and portfolio specific
risks. The above impact was partially offset by a smaller reserve build due to lower growth in unfunded lending
commitments.
•Non-Interest Expense: Non-interest expense increased by $125 million, or 13%, to $1.1 billion in 2014,
compared to $958 million in 2013, driven by operating expenses associated with continued investments in
business growth.
69 Capital One Financial Corporation (COF)